
How do I tag answers?
Every company that listens to the voice of its customers realizes that studying and measuring customer experiences is very difficult. Why? Because customer experiences in contact with a brand are based on emotions. And of course – using the Net Promoter Score, Customer Effort Score or CSAT survey, you can find out how many customers speak well of our company, how many speak badly, and what the average satisfaction, loyalty, or likelihood to recommend is. However, all these surveys can only tell you WHAT (good or bad) is happening in the company, but not WHY it is happening.
To answer the question WHY, there is no other way than to listen to your Customers with due attention. By asking Customers open-ended questions, we do not impose on them what they have to tell us. Nevertheless, a company should have the skills to quantitatively analyze the qualitative voice of the customer and… draw the best conclusions from it. And this is where CustomerHero comes to the rescue, giving its users the ability to create tags, and then assign them to customer responses.
Below we have prepared for you detailed instructions on how to quantitatively analyze feedback received from customers in CES, CSAT, NPS surveys, or any other online surveys regarding customer-brand contact. Let's begin!
STEP 1: CREATING TAGS
[Important information]: To be able to start using response tagging, your survey should collect at least one completion. Otherwise, you will get this view with the ability to add tags disabled:
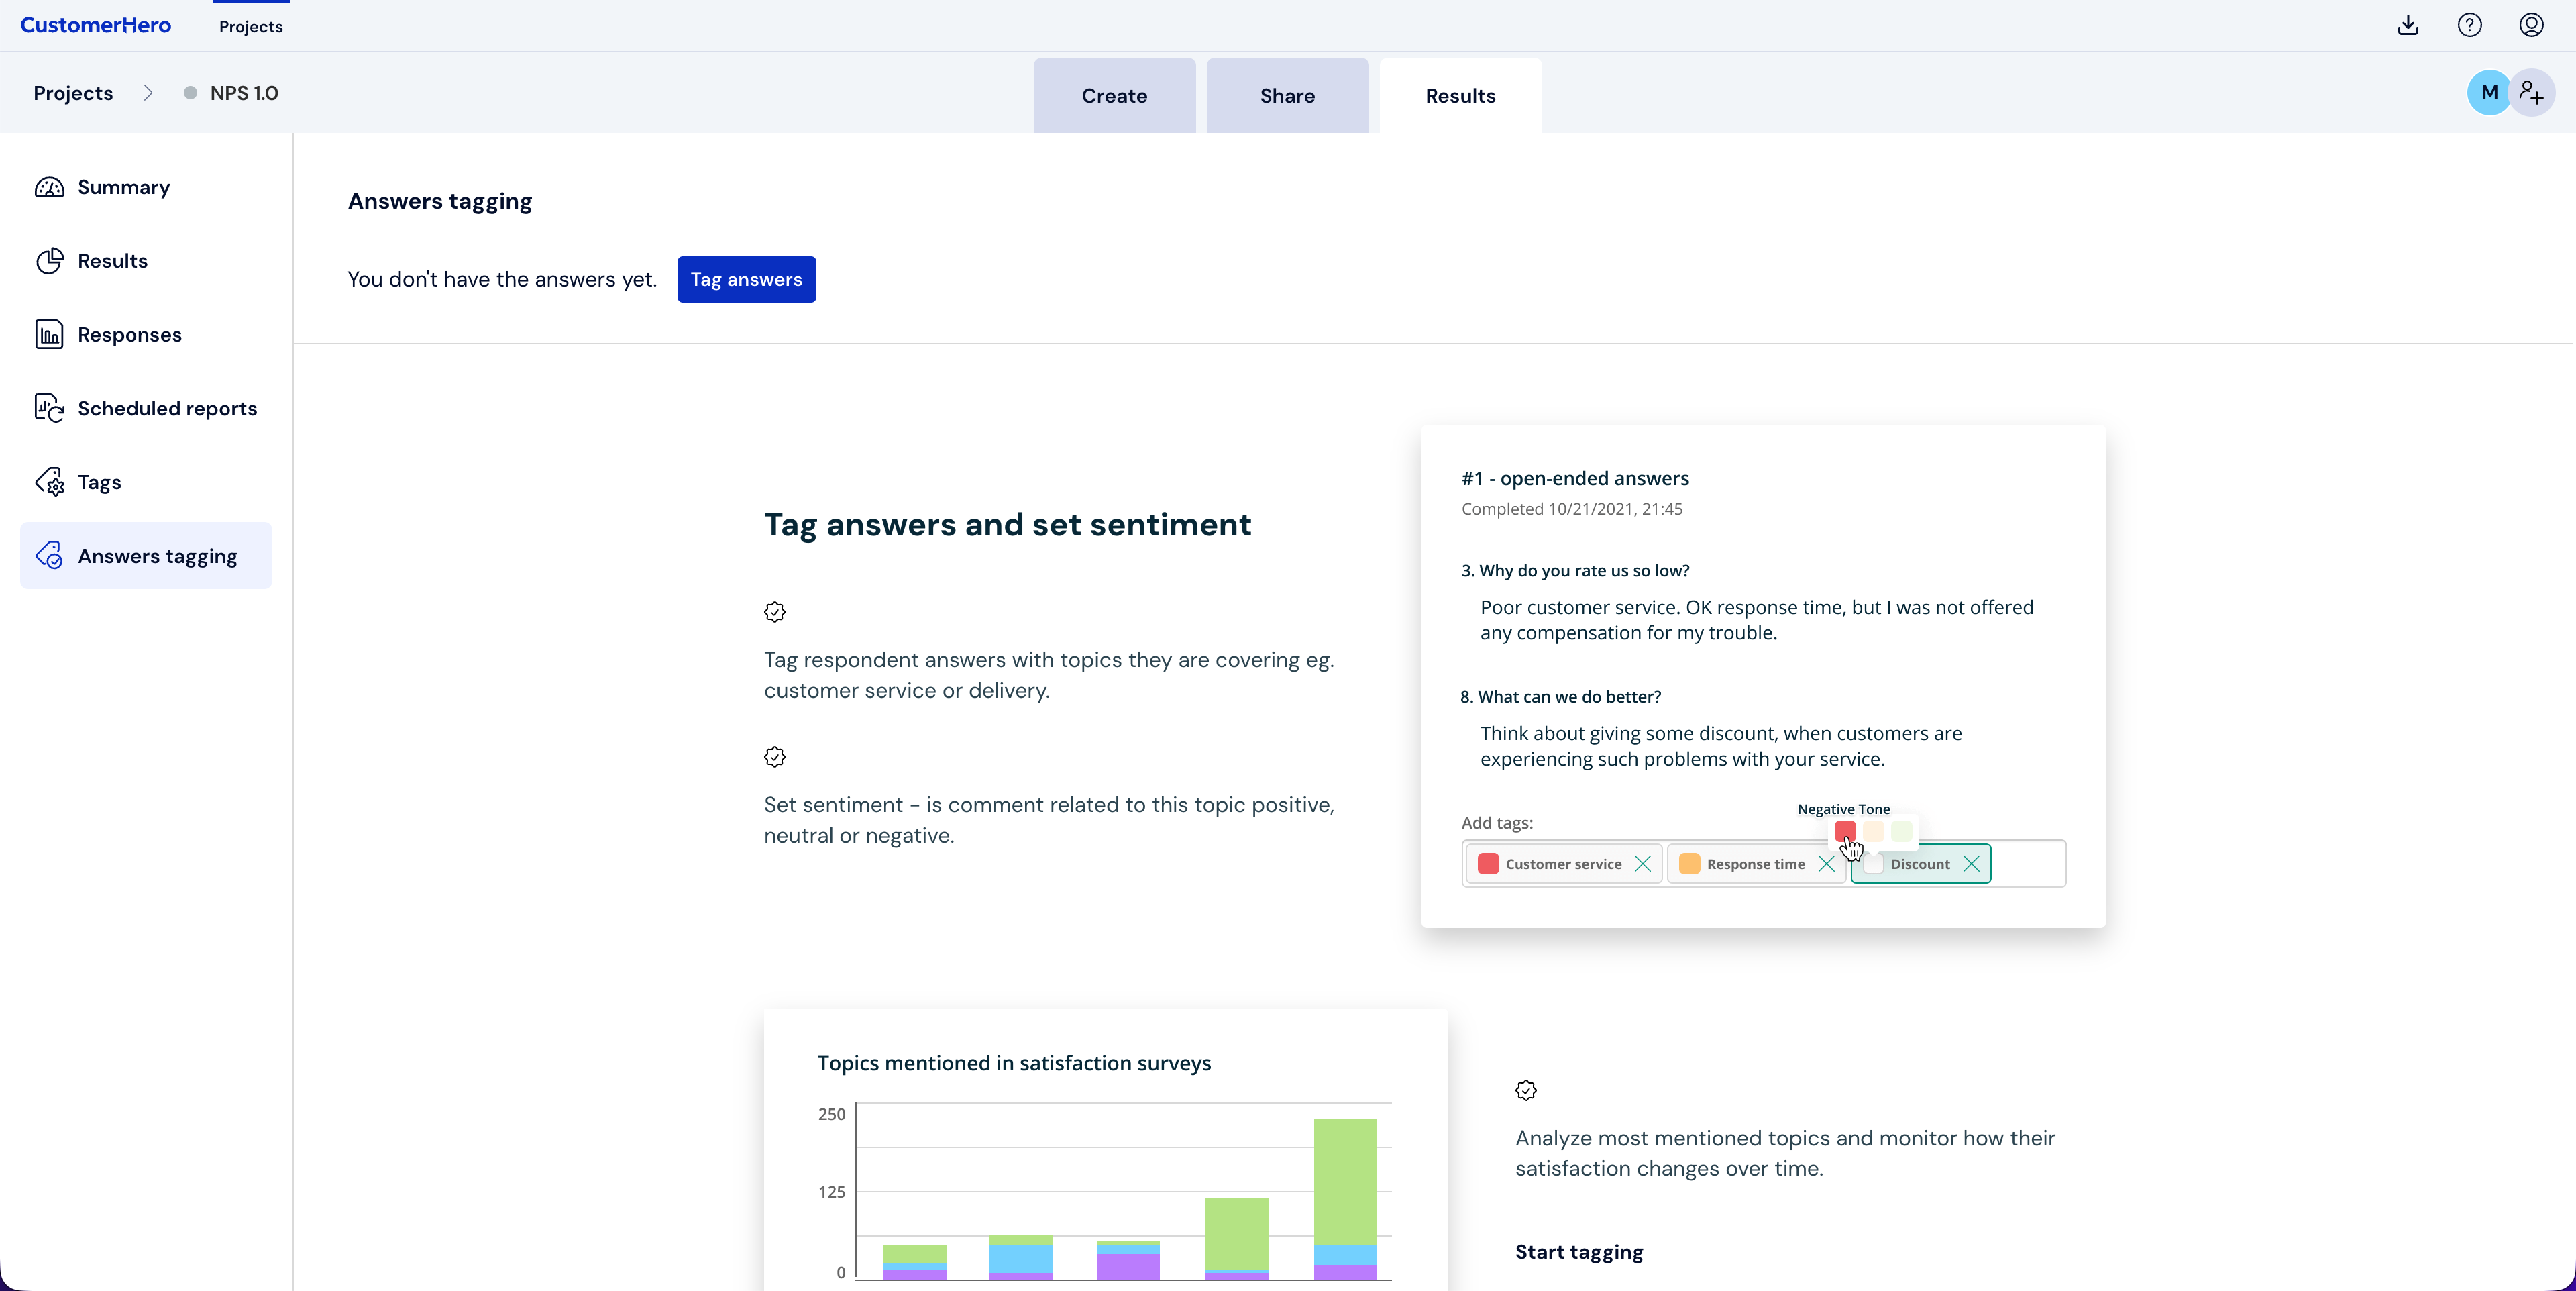
If one or more surveys have already been conducted and results have been collected, you can proceed to their advanced analysis. The first step in the response tagging process is to create a set of tags, i.e., a so-called code key.
1. To do this, go to the Results tab in the survey project, and then click on the Tags tab located on the left side.
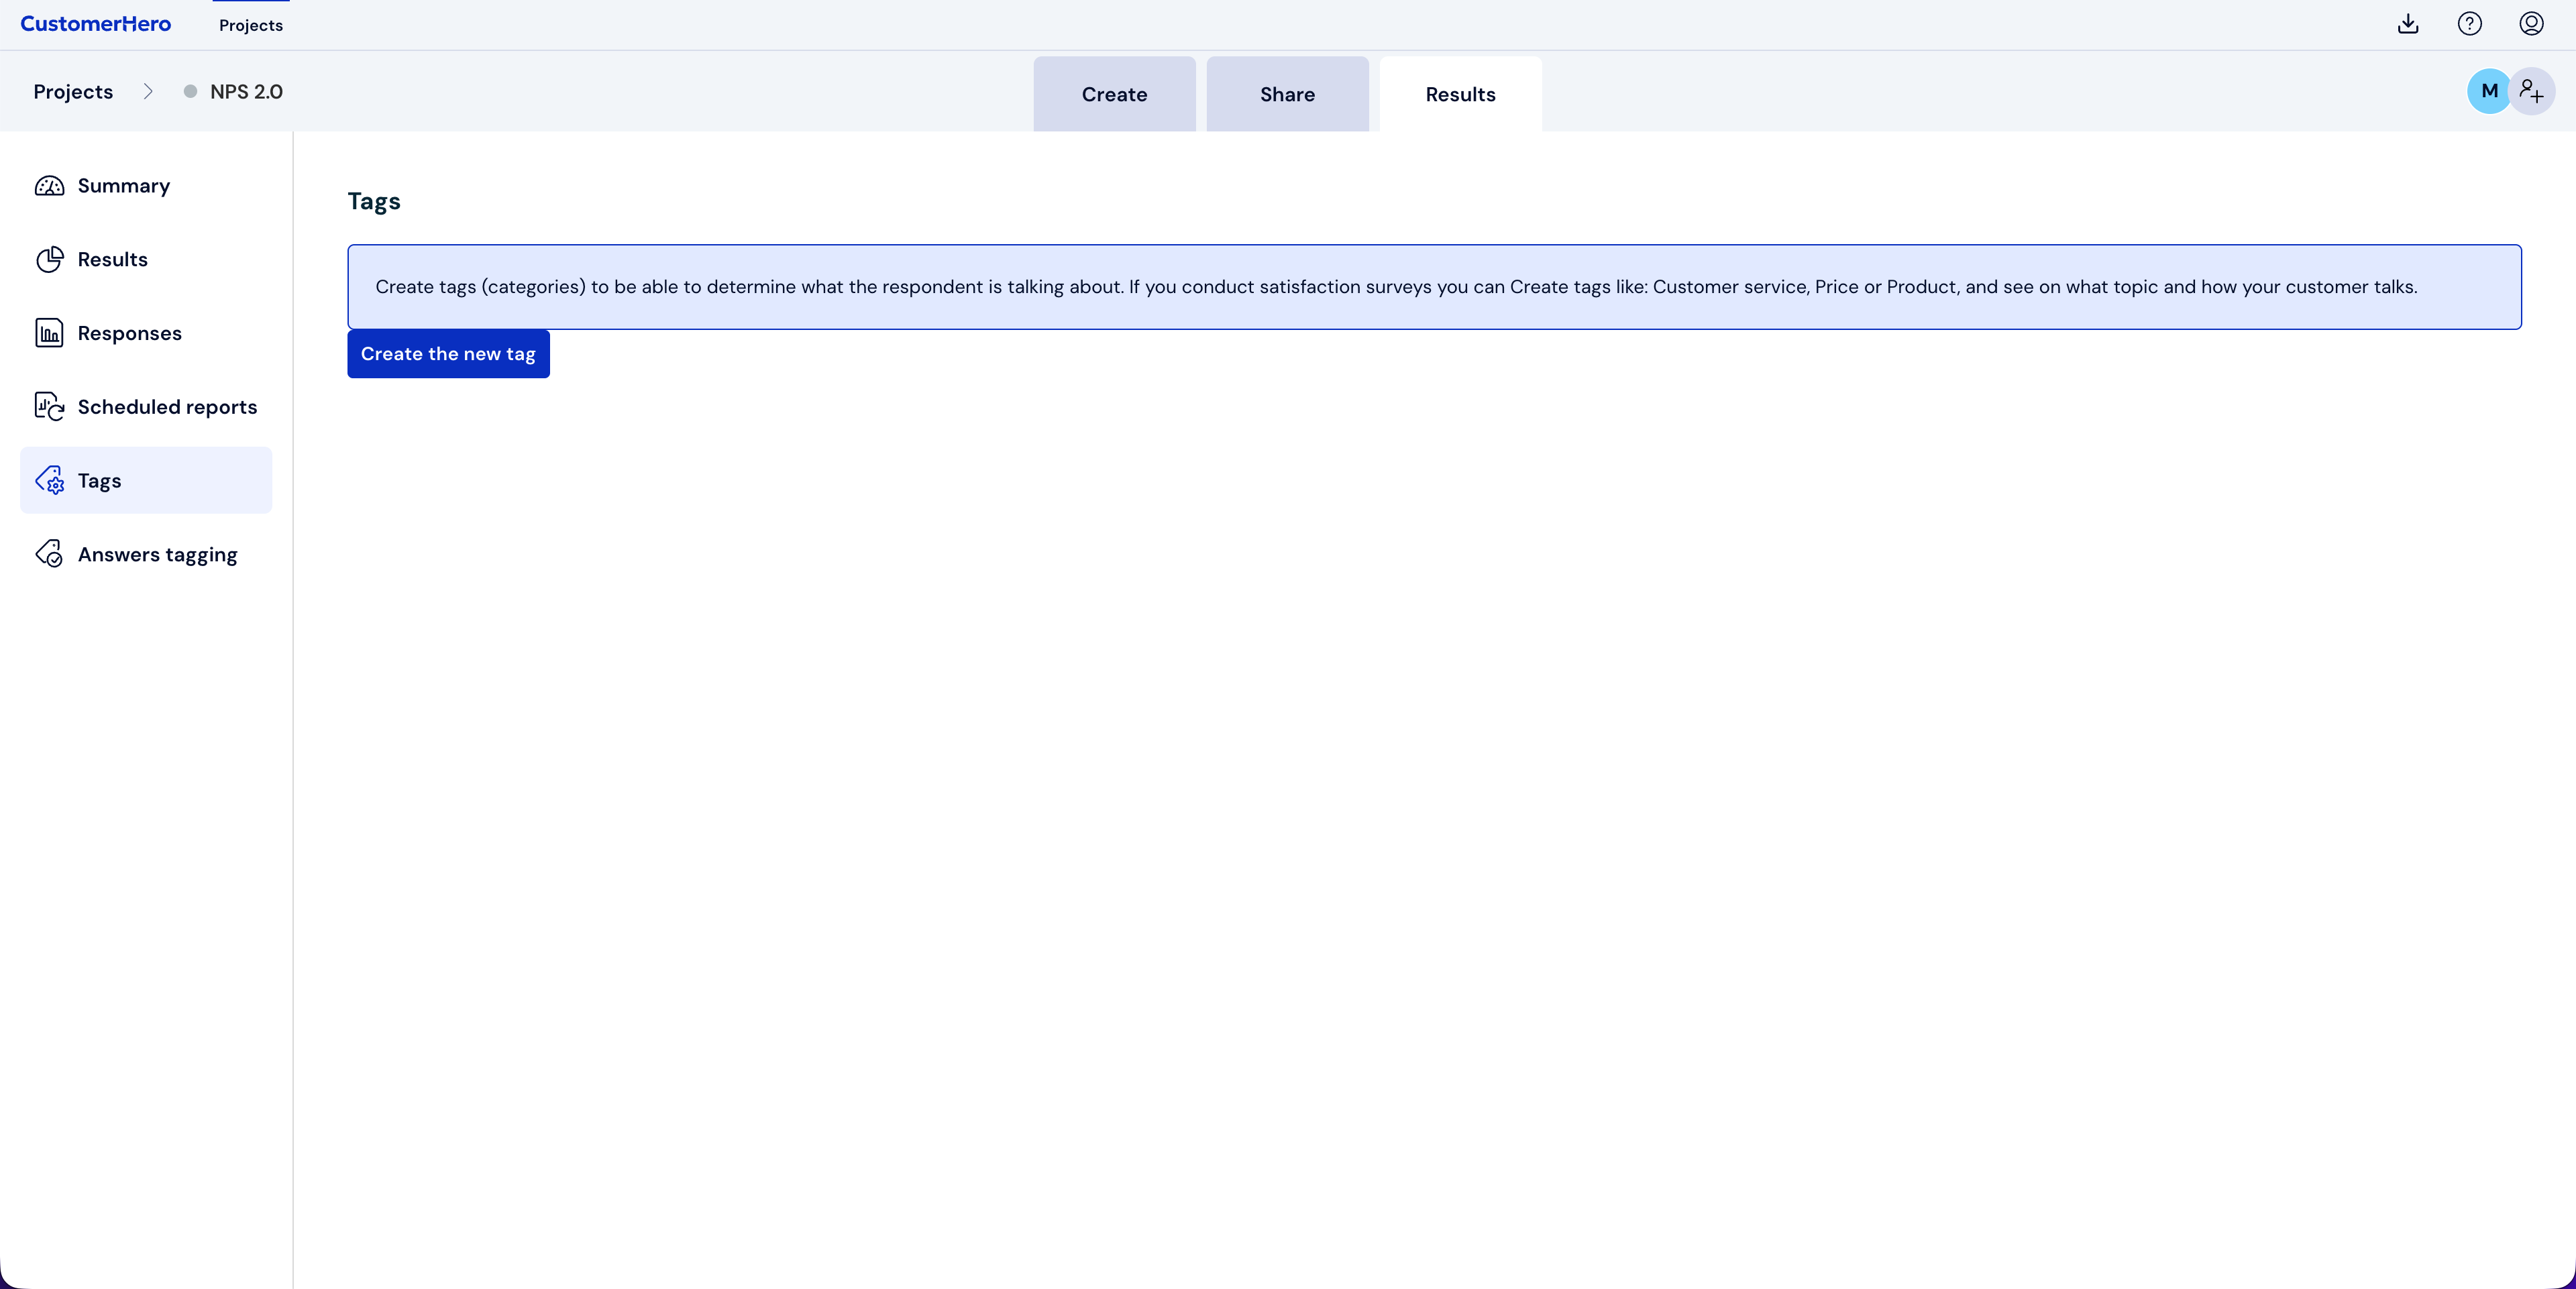
2. In the next step, click: Create a new tag.
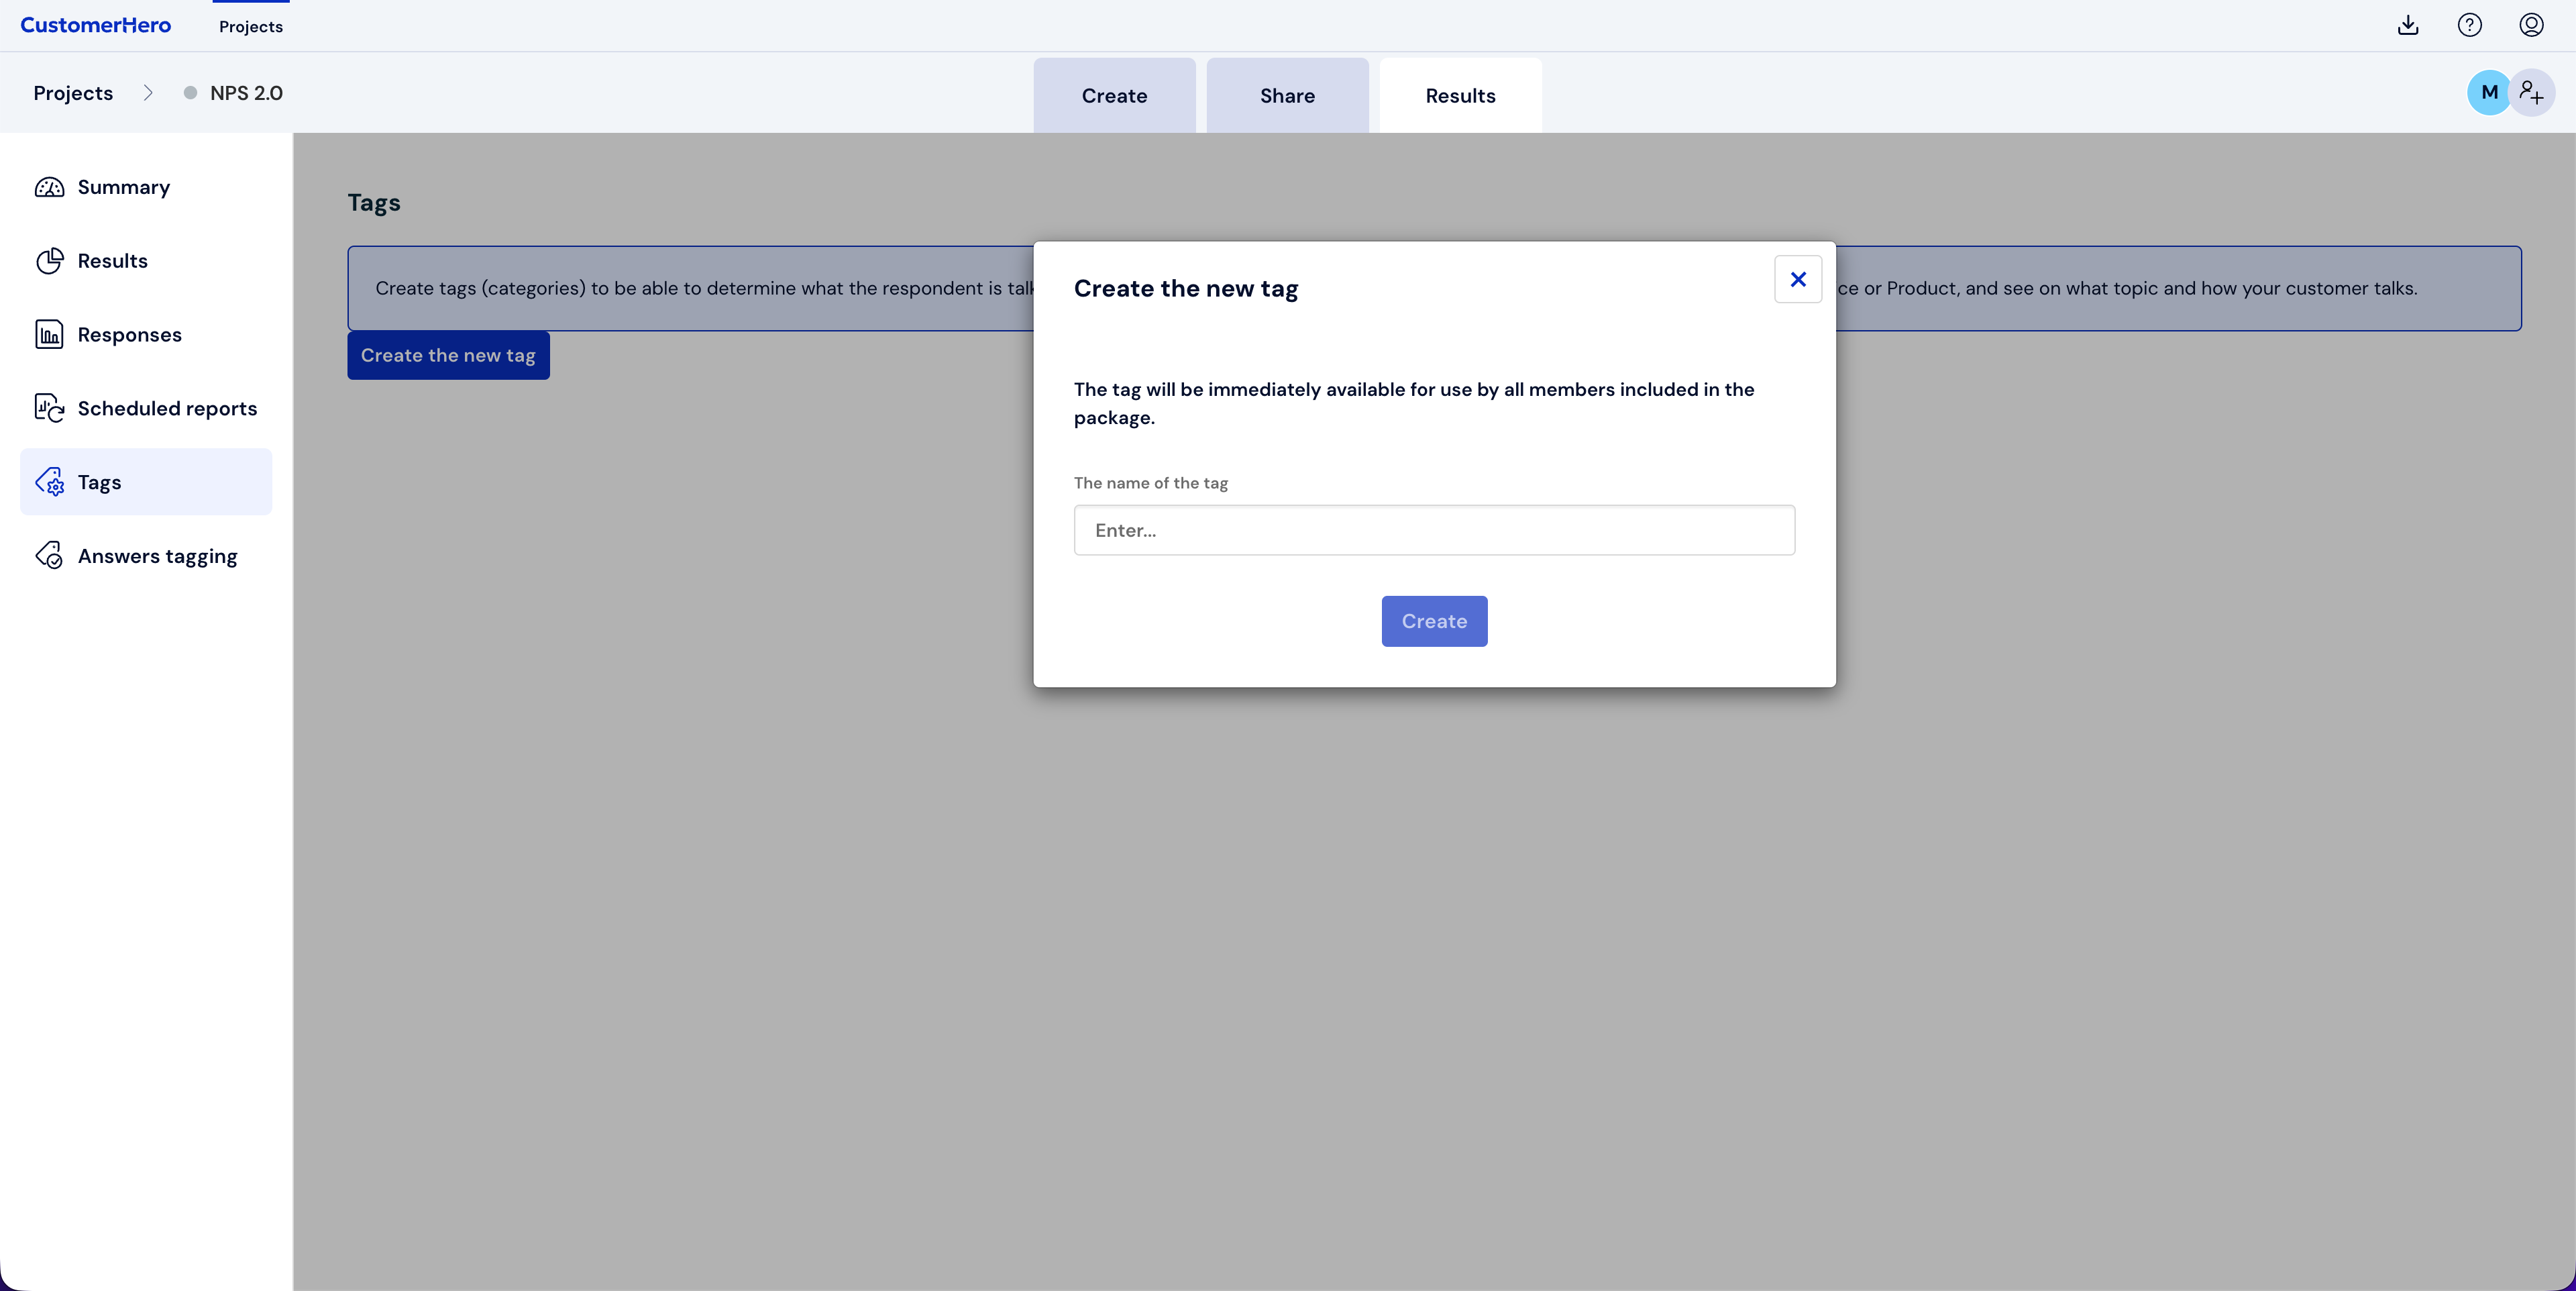
Before creating tags, you need to think about what your customers are talking about, because it is with these tags that the feedback obtained during surveys will be categorized. For example, if you are conducting an NPS survey assessing the likelihood to recommend in a telecommunications company, your tags can be anything the customer includes in the justification of their rating (the open-ended question added to the survey), i.e., touchpoints at the customer-brand interface. This can be, for example, the price of the service, the offer, the consultant's competence, the speed of service, quality, etc.
What if the customer did not leave an answer to the open-ended question?
It happens that the respondent does not leave any comment in response to an open-ended question. In such a situation, it is worth adding a “no response” tag.
Thanks to this, it will be possible to effectively use a filter showing untagged responses (which will be discussed later in this guide). If such a tag is not assigned, the given response will still be visible as “untagged”, which may lead to its re-analysis and unnecessary duplication of work.
At a later stage of analysis, responses marked as “no response” can be easily filtered out and excluded from further consideration.
3. In the Tags tab, you can see a list of created categories that can be edited at any time. You must remember that:
tags are created for the entire account, not for a specific survey,
new tags can be added at any time, i.e., if during tagging you notice that an appropriate tag is missing, go to the Results tab in any project and select Tags. After creating a new tag, you can return to tagging responses and add this tag, which should already appear on the drop-down list.
STEP 2: TAGGING RESPONSES
Where to start?
In this step, we will explain how to assign previously created tags to the statements provided by the customer. We assign categories individually – to each statement given in a specific survey (a single completion). To start tagging responses, select the survey or test you want to categorize from the list, and then:
1. Go to the Results tab and then Response tagging.
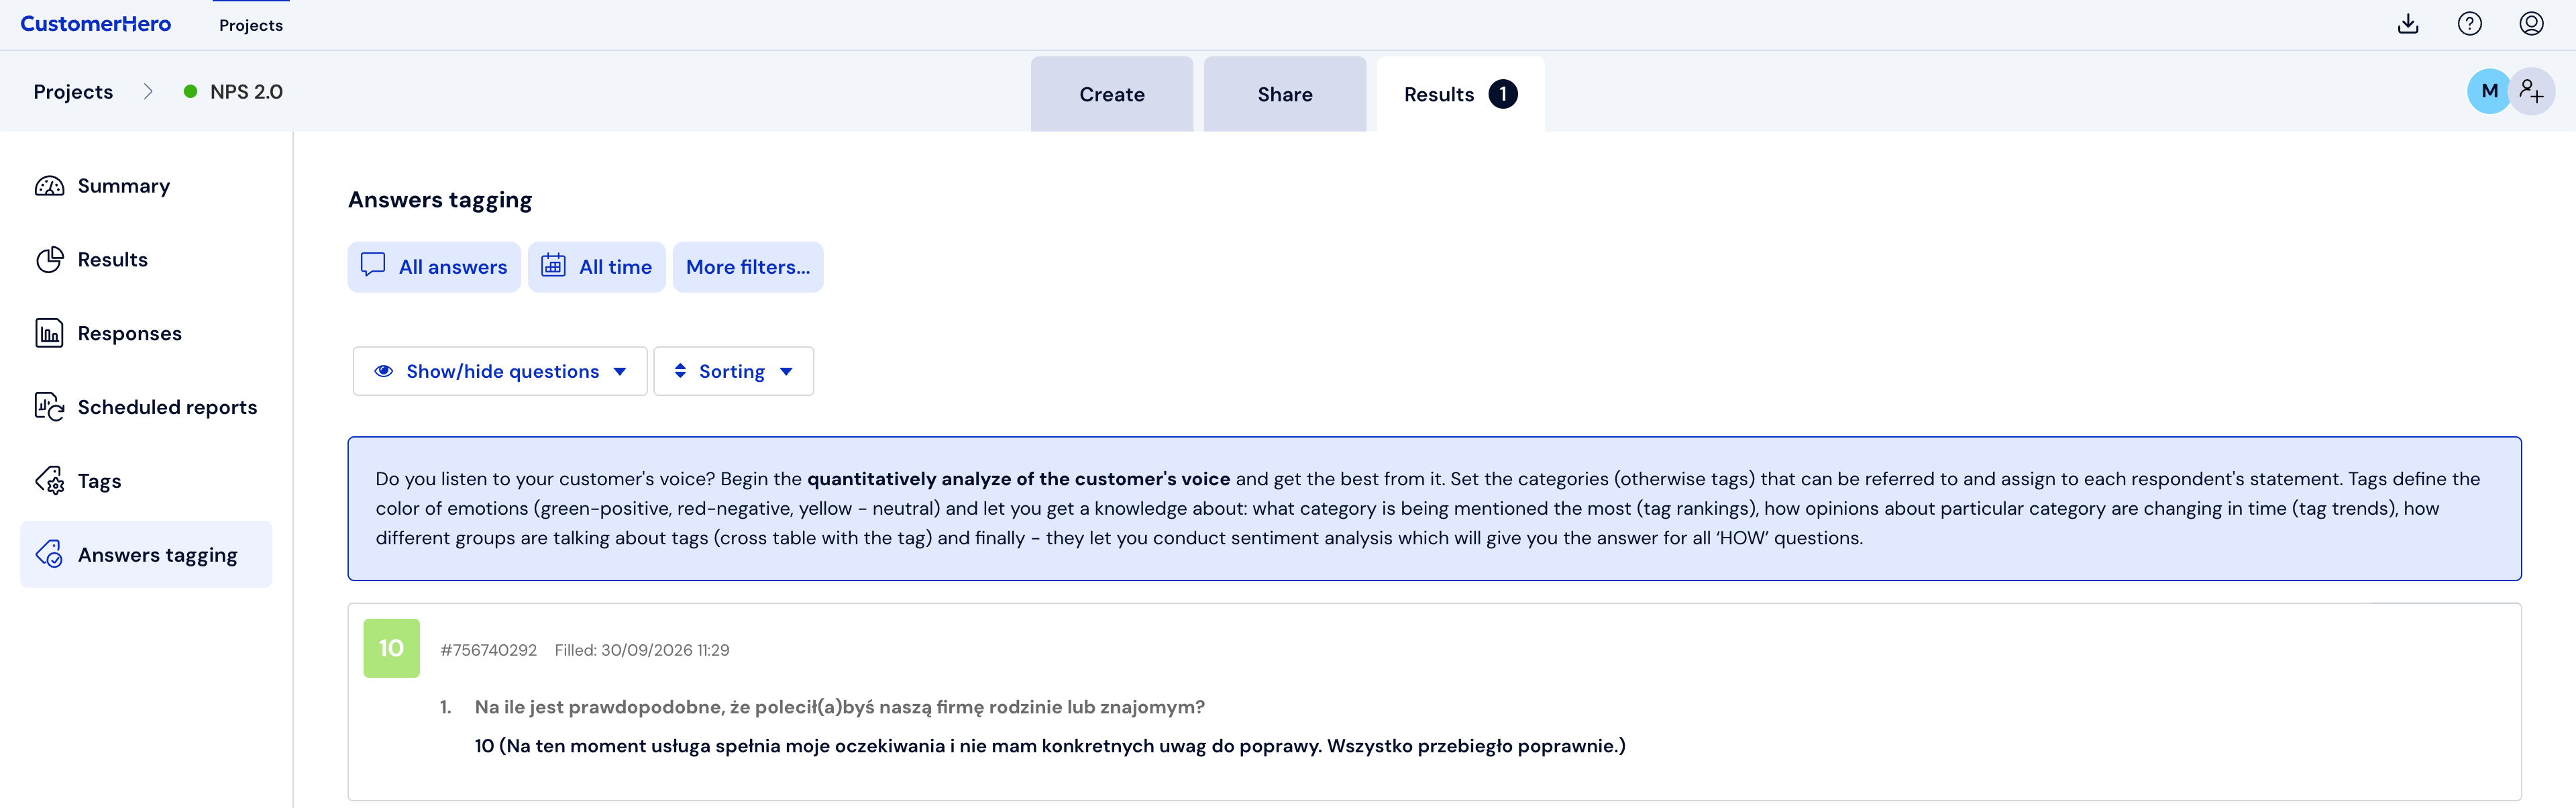
2. After clicking, you will see all completions of the selected survey on the screen.
In the top panel, there is a “Show/hide questions” option, which allows you to select one or more questions to be displayed below. You can also select which segments and attributes (i.e., respondent data) you want to display.
This data can come from various sources – for example:
from the answer to the e-mail address question included in the survey,
or from attributes added during the import of the contact list.
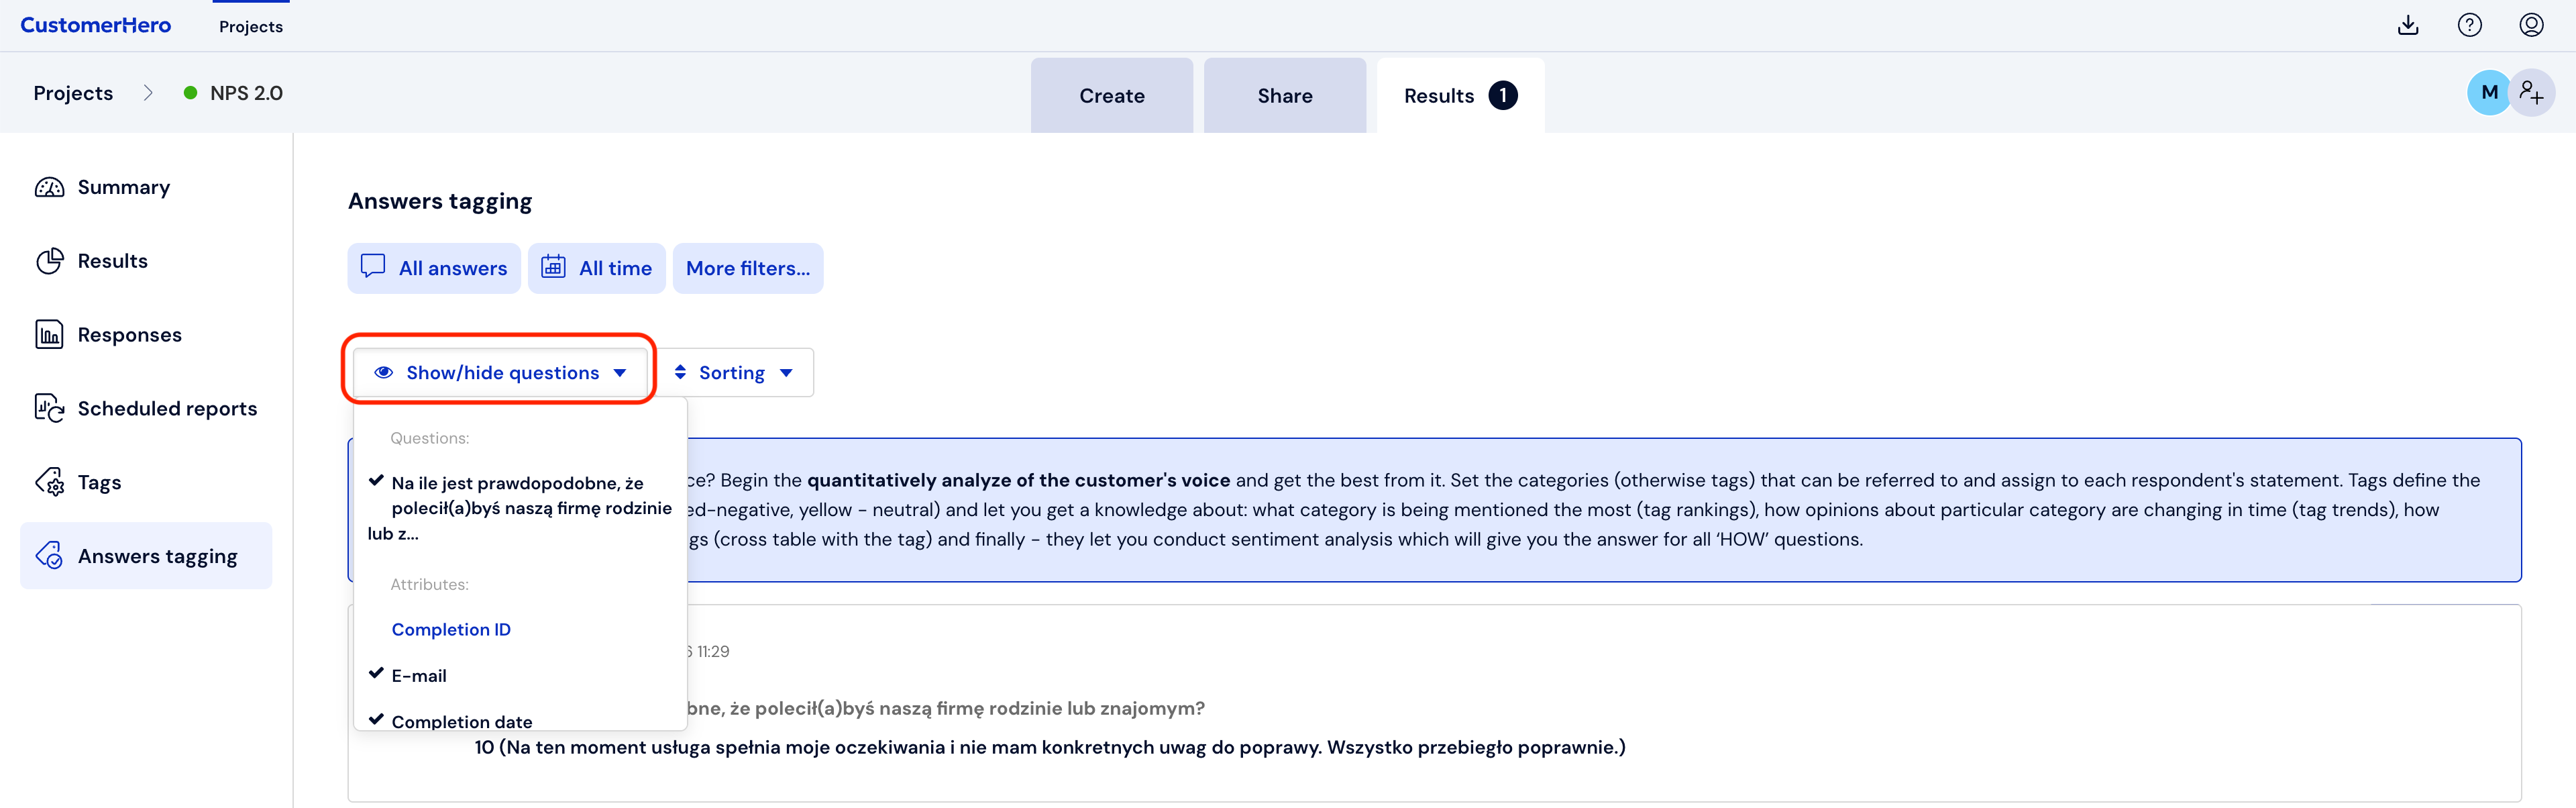
Response filter settings
From here, you can also set a filter according to which completions for categorization will be displayed. Below we present how to enable appropriate filters and which filters are worth setting at the beginning of the tagging process so that work with tags runs smoothly.
To streamline response tagging and avoid repeating work, we recommend setting the filter “Any tag → Is unassigned”.
Thanks to this, you will only see comments in the view that have not yet been tagged – that is, those that actually require analysis.
We create it as follows:
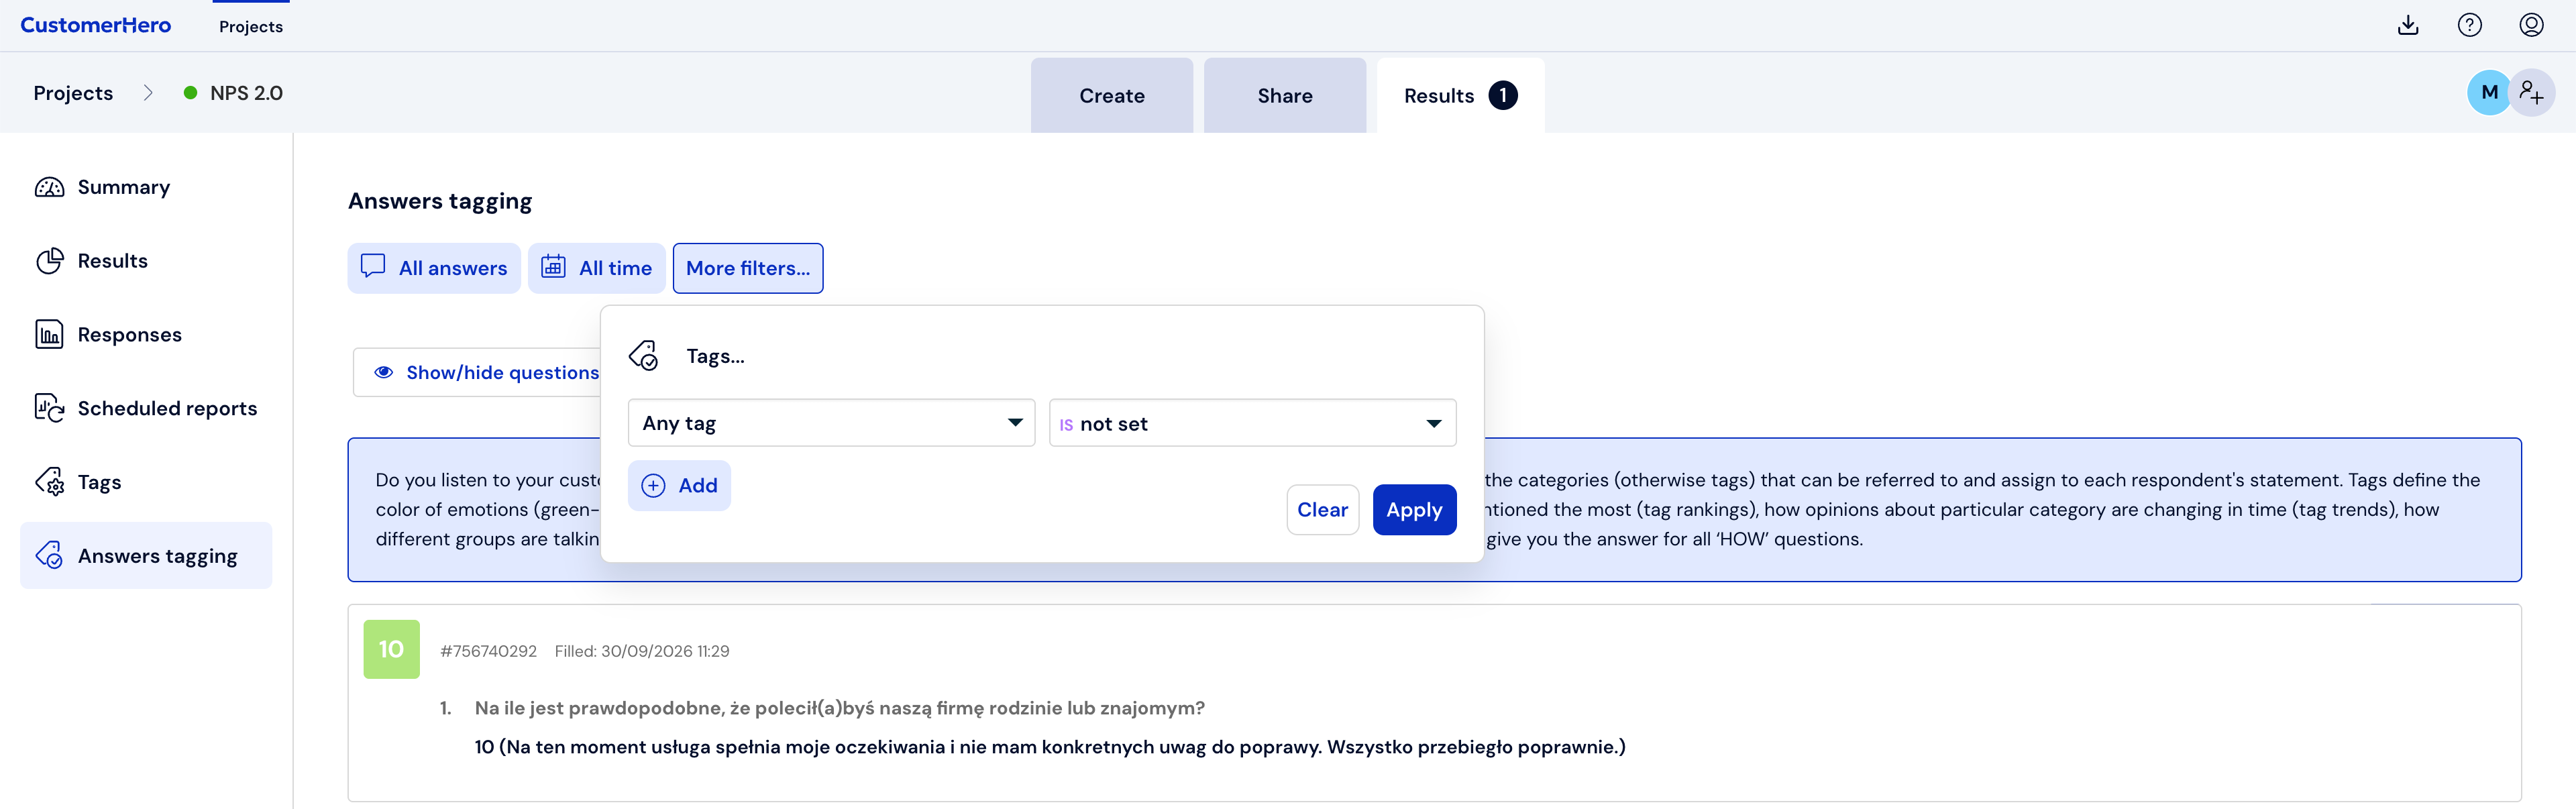
Applying such a filter will certainly make working with tagging easier. If we have a large number of responses to analyze and we need to divide the work over several days, the filter “Any tag → Is unassigned” will allow us to see only those statements that have not yet been tagged upon our return.
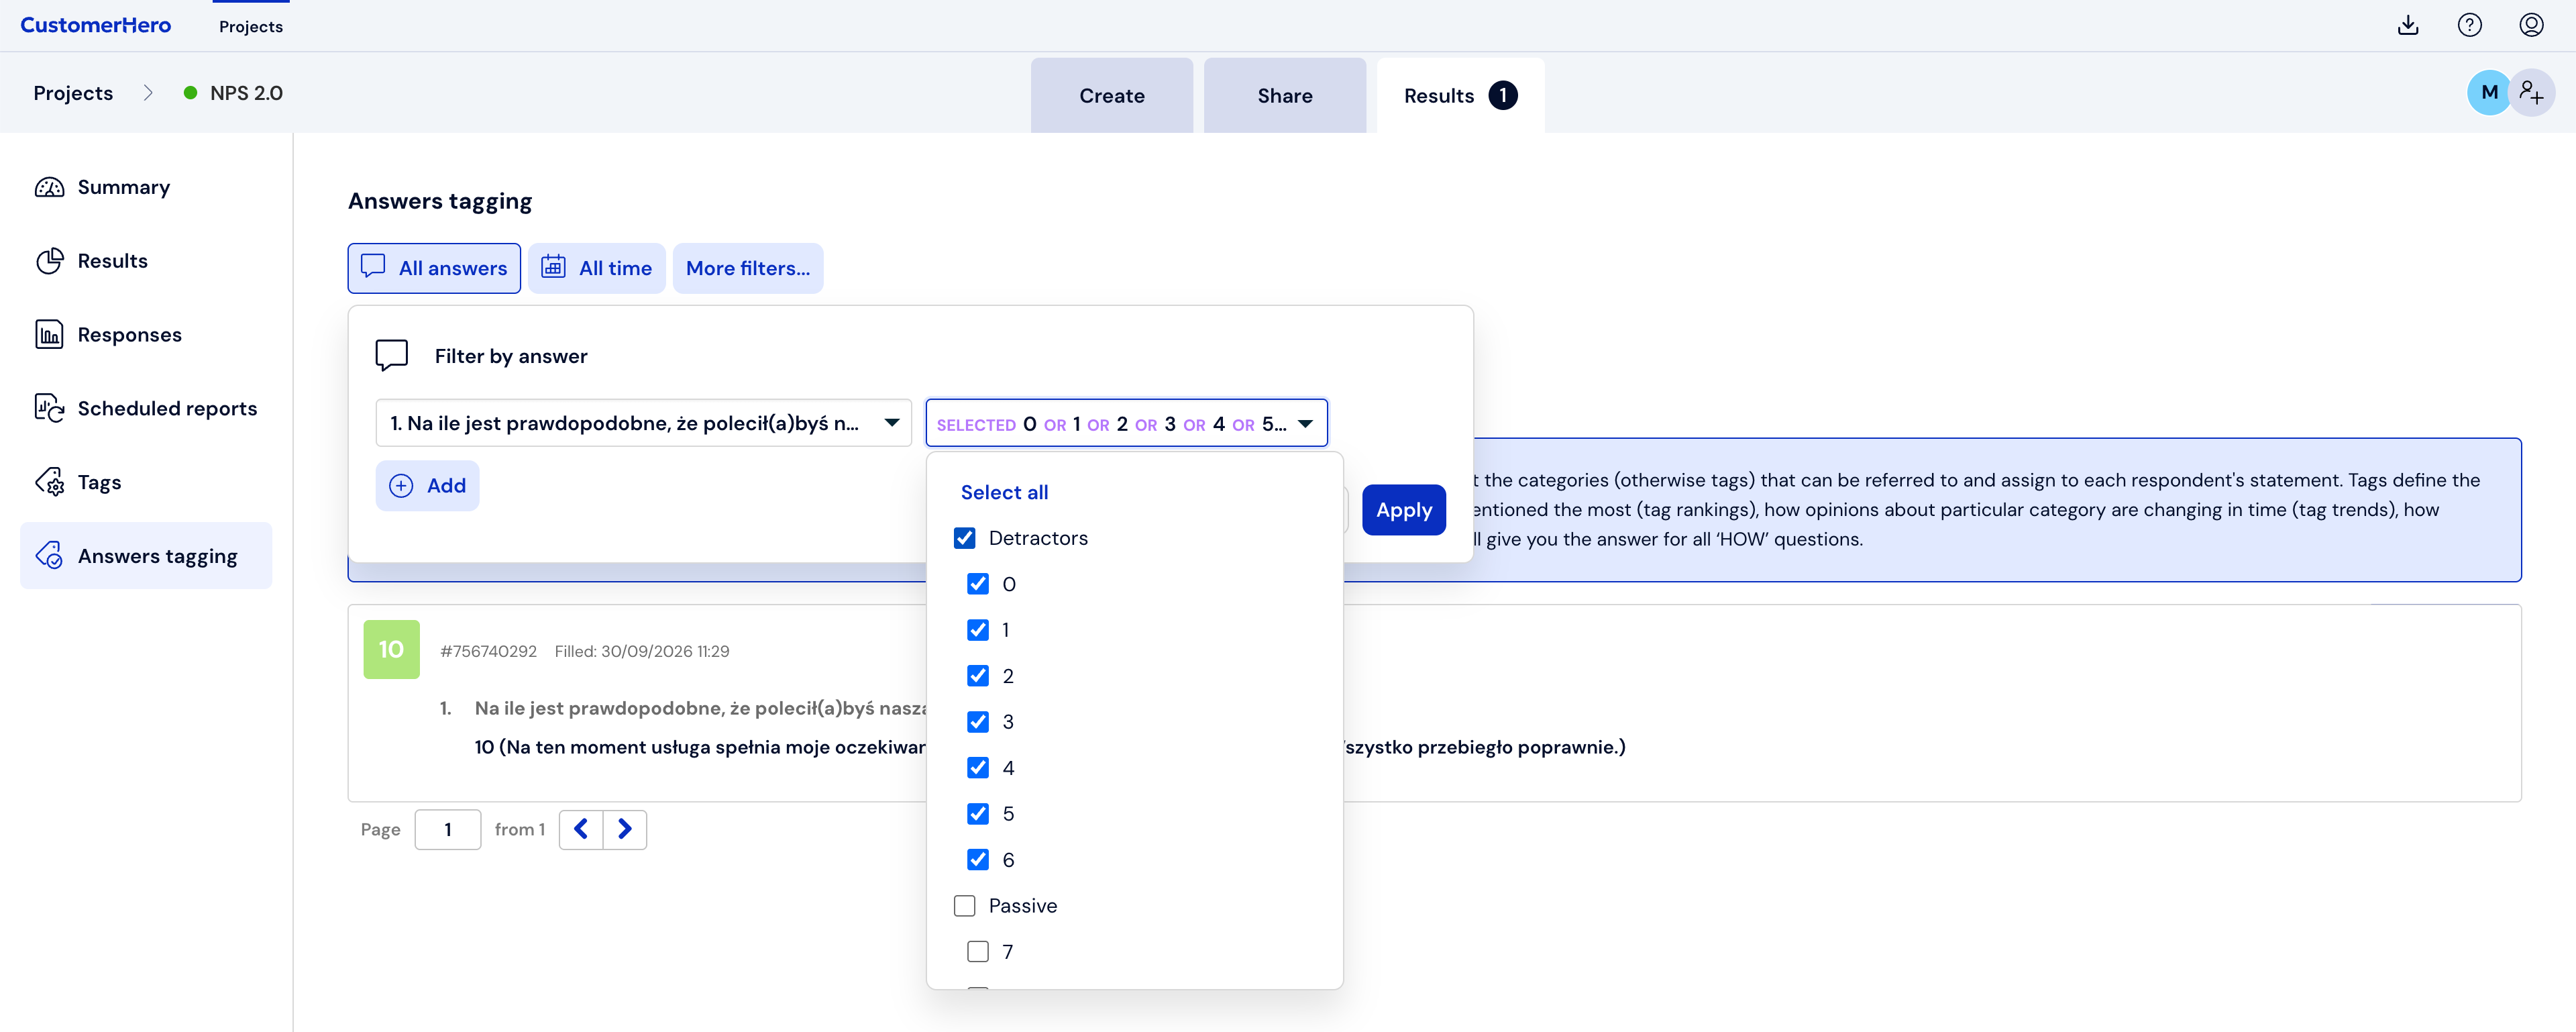
We can also set other filters if, for example, several people are to deal with tagging and so, for example:
one person can analyze the responses of Detractors, another of Passives, and another of Promoters. In this case, it is worth setting a filter for a given group so that each analyst works only on their range of statements.:
it is also possible to filter responses by date. For example, we can set one filter for statements from the last 14 days, and another — for those older than 14 days. This will make it easier to manage the analysis depending on the time the responses came in:
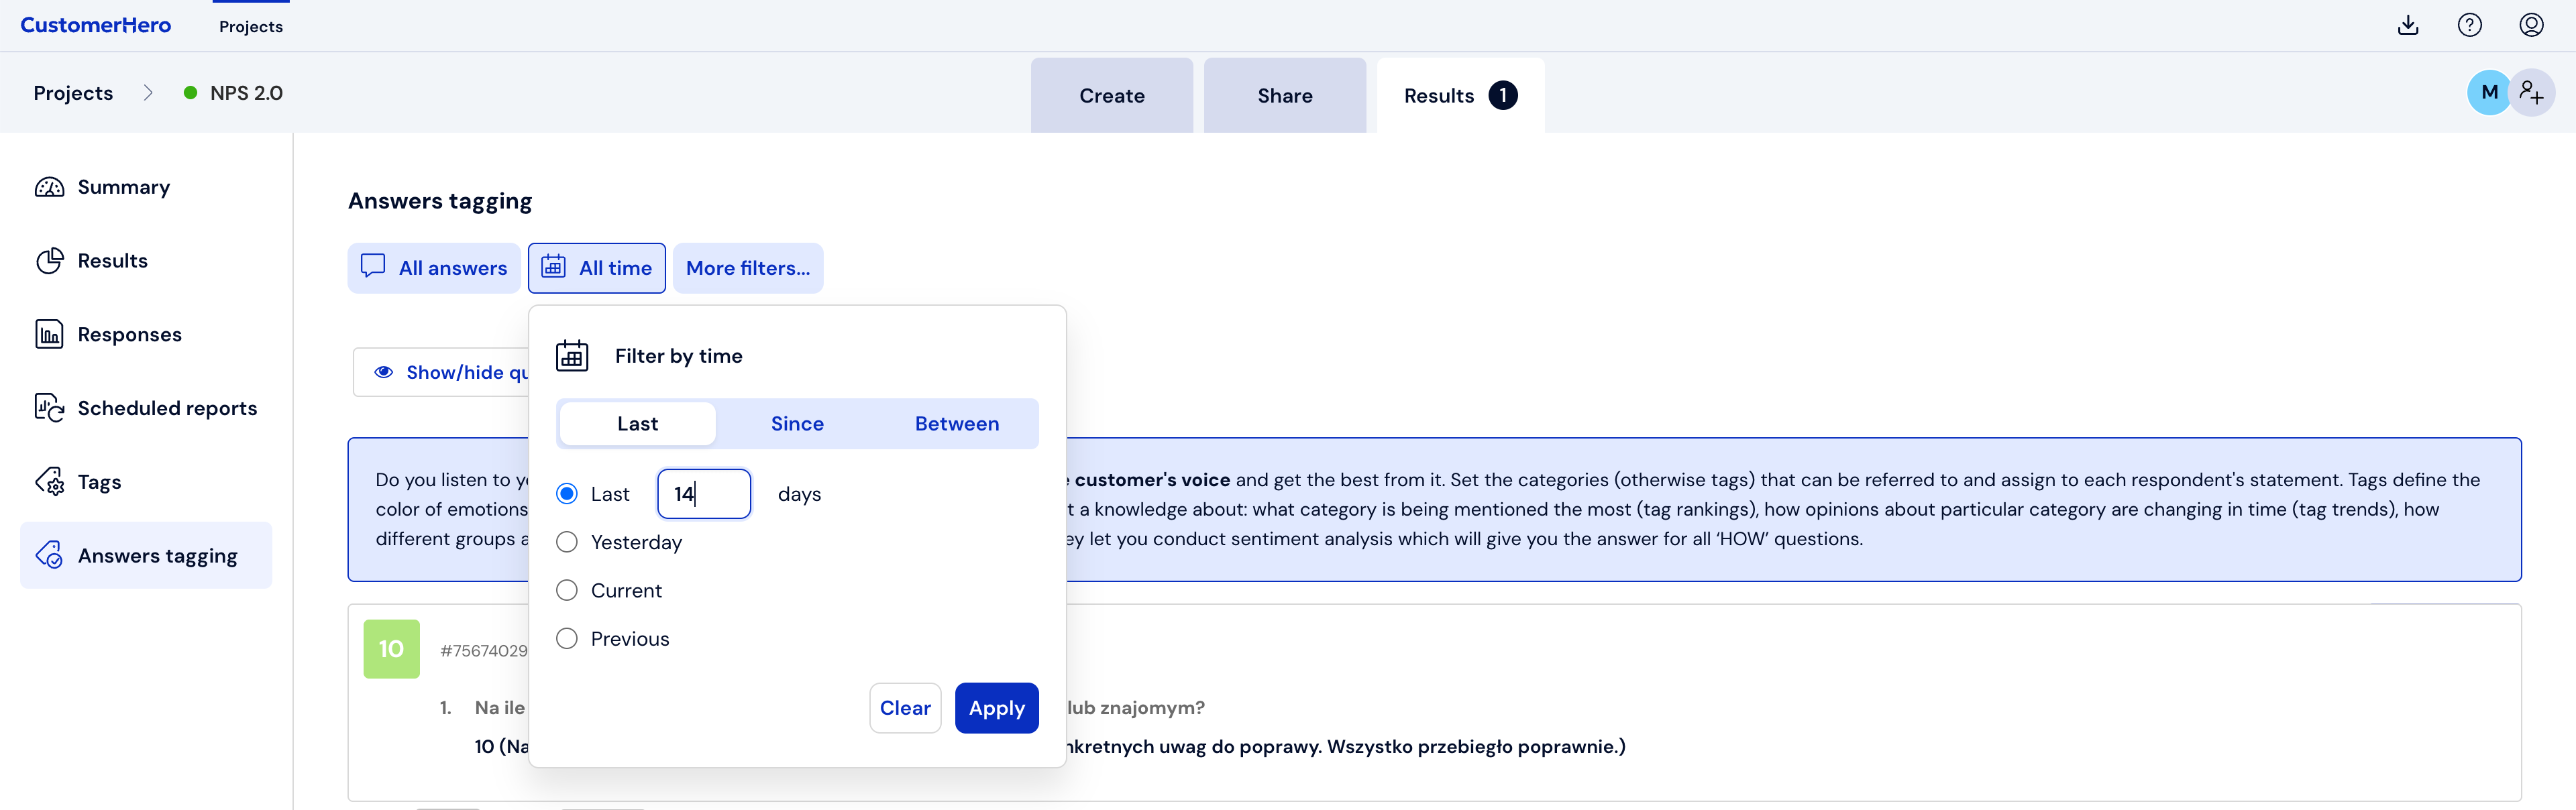
Then each person involved in tagging can work on their filter without getting in anyone's way.
[Important information: Every time you enter the Response Tagging tab, you need to create the filter list anew, because it does not save automatically].
Response tagging - next steps
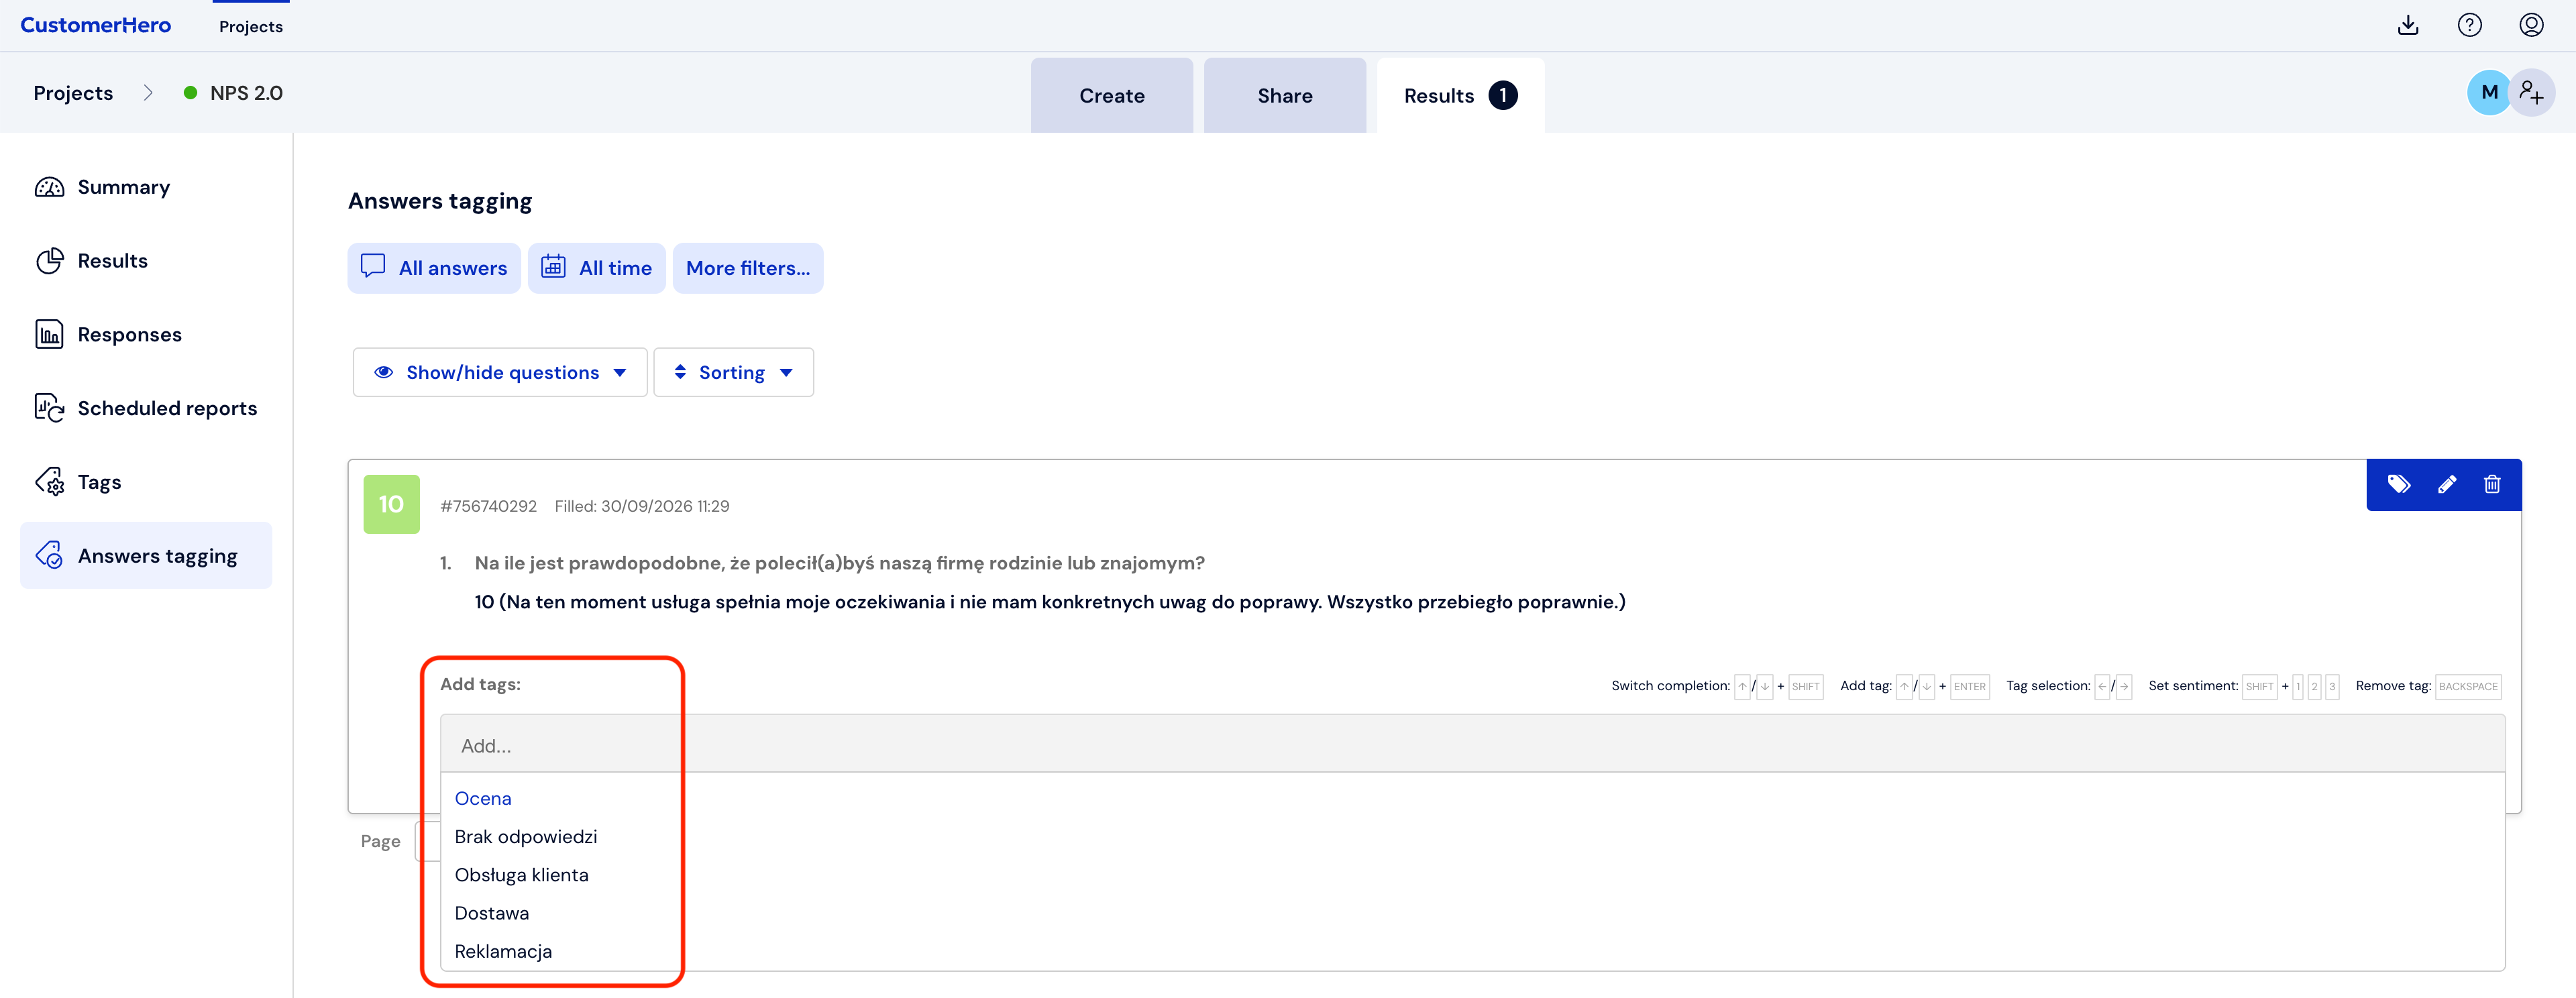
After selecting the appropriate data view or adding a filter, we can proceed to tagging. To do this, just click on the selected completion, and a list of all created tags will appear on the screen. At this stage:
first we choose a specific tag that the completion relates to – it can be either one or several tags (in the presented example, the category is a product):
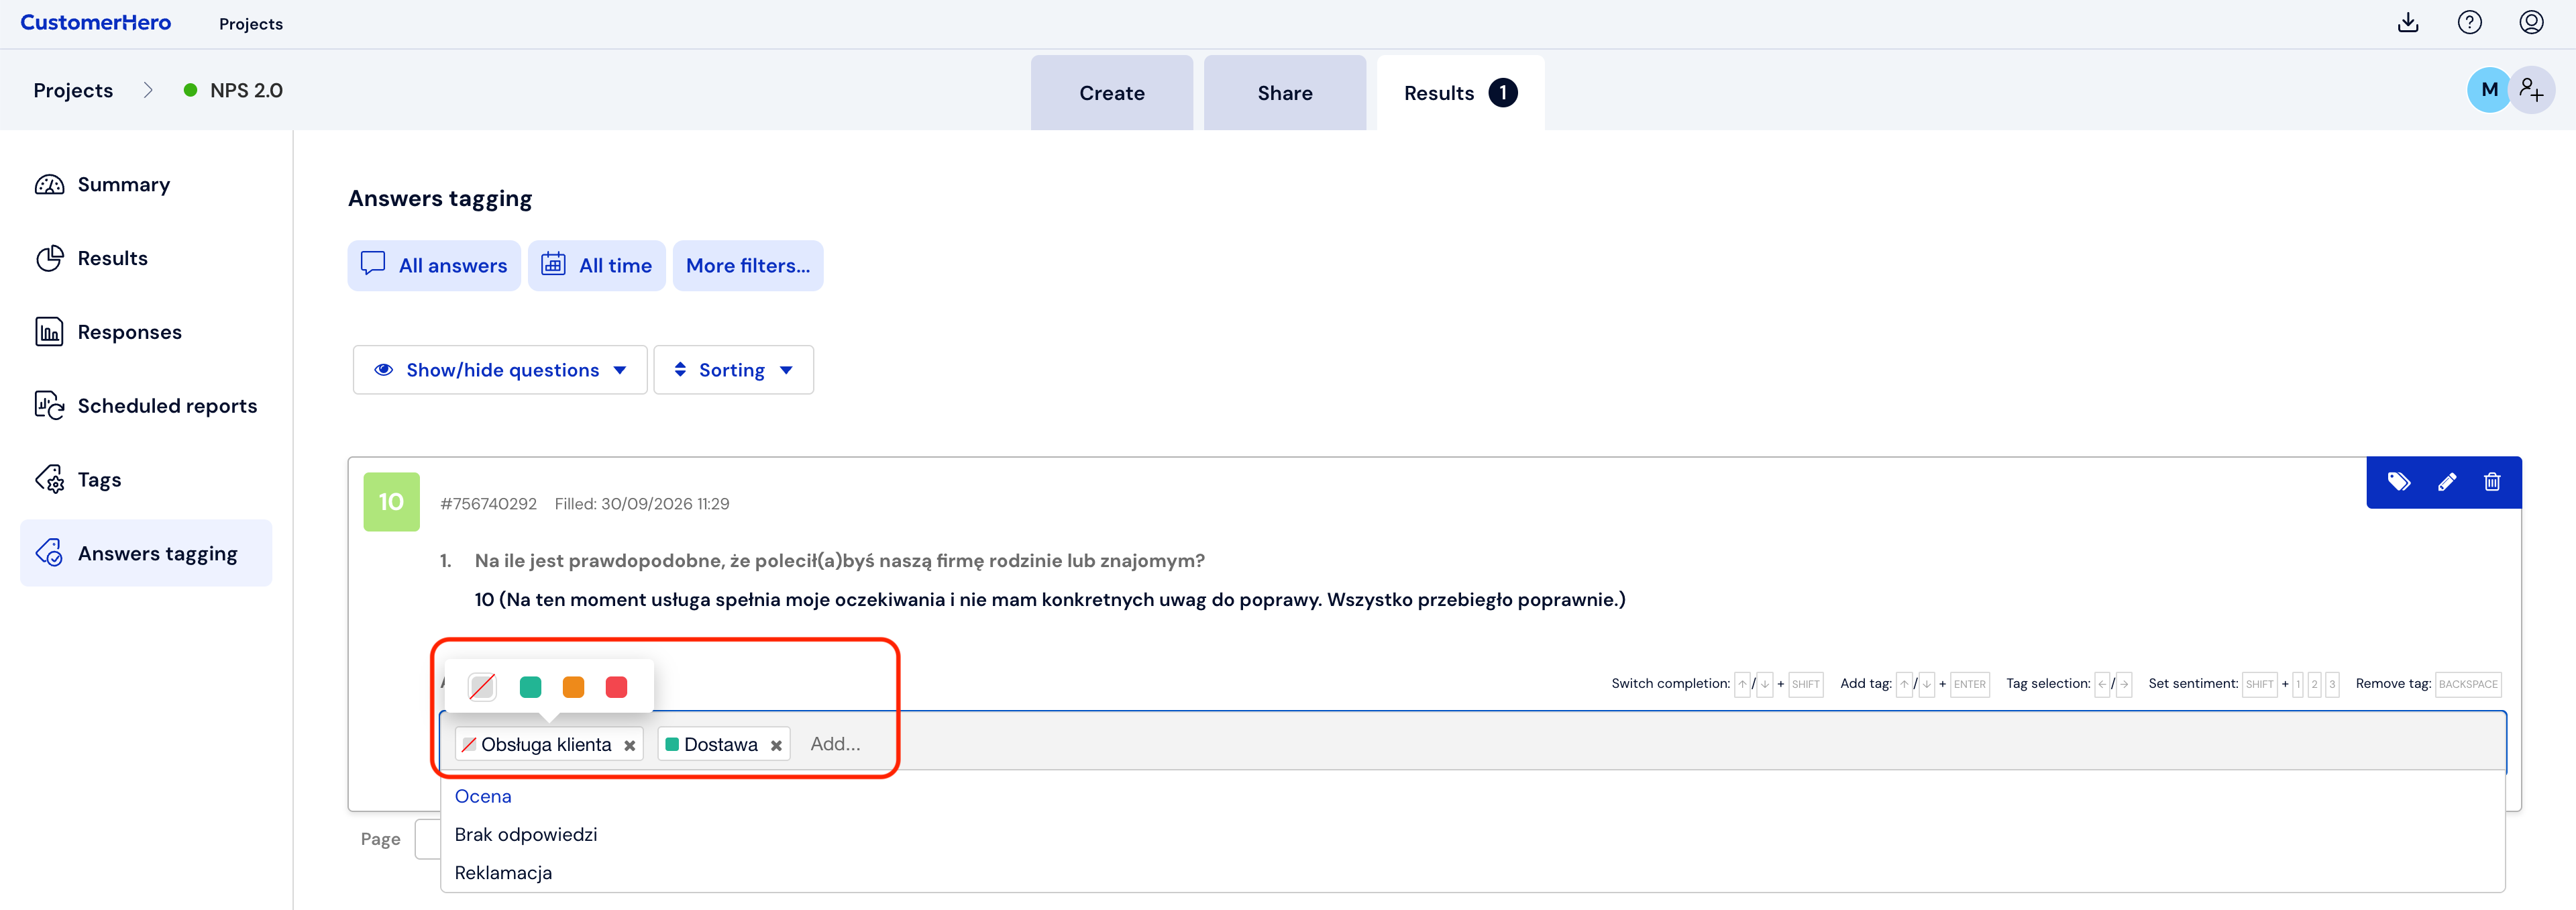
we determine the emotional tone of the tag: green – positive, orange – neutral, and red - negative. Please note that in one statement each tag can be marked in a different way (e.g., the customer can give an NPS of 8 and positively evaluate the customer service center's work, but negatively evaluate the speed of the application). A gray square with a red strike-through means that no emotion has been assigned to a given tag:
Facilitating response tagging - essential keyboard shortcuts
To facilitate and speed up the tagging process, CustomerHero allows the use of keyboard shortcuts:
You can navigate between completions using the SHIFT + up/down arrow shortcuts. The user is then automatically moved to the beginning of the next completion. The tagging option for the next completion is also opened automatically.
After clicking on a specific completion (or switching with a keyboard shortcut), the list of available tags is immediately displayed on the screen. You can switch tags using the up/down arrows. To add an active tag, simply press the enter key.
Using the (right/left) arrows, the user can select an active tag and then: delete it using the delete or backspace keys, or edit its coloring (emotion).
The user can add color/emotion using the mouse by hovering over the selected tag and color or by using the SHIFT + 1,2,3 keyboard shortcut. When using the keyboard, it is not possible to remove an emotion already assigned to a tag.
For convenience, the shortcuts are also visible on the screen:
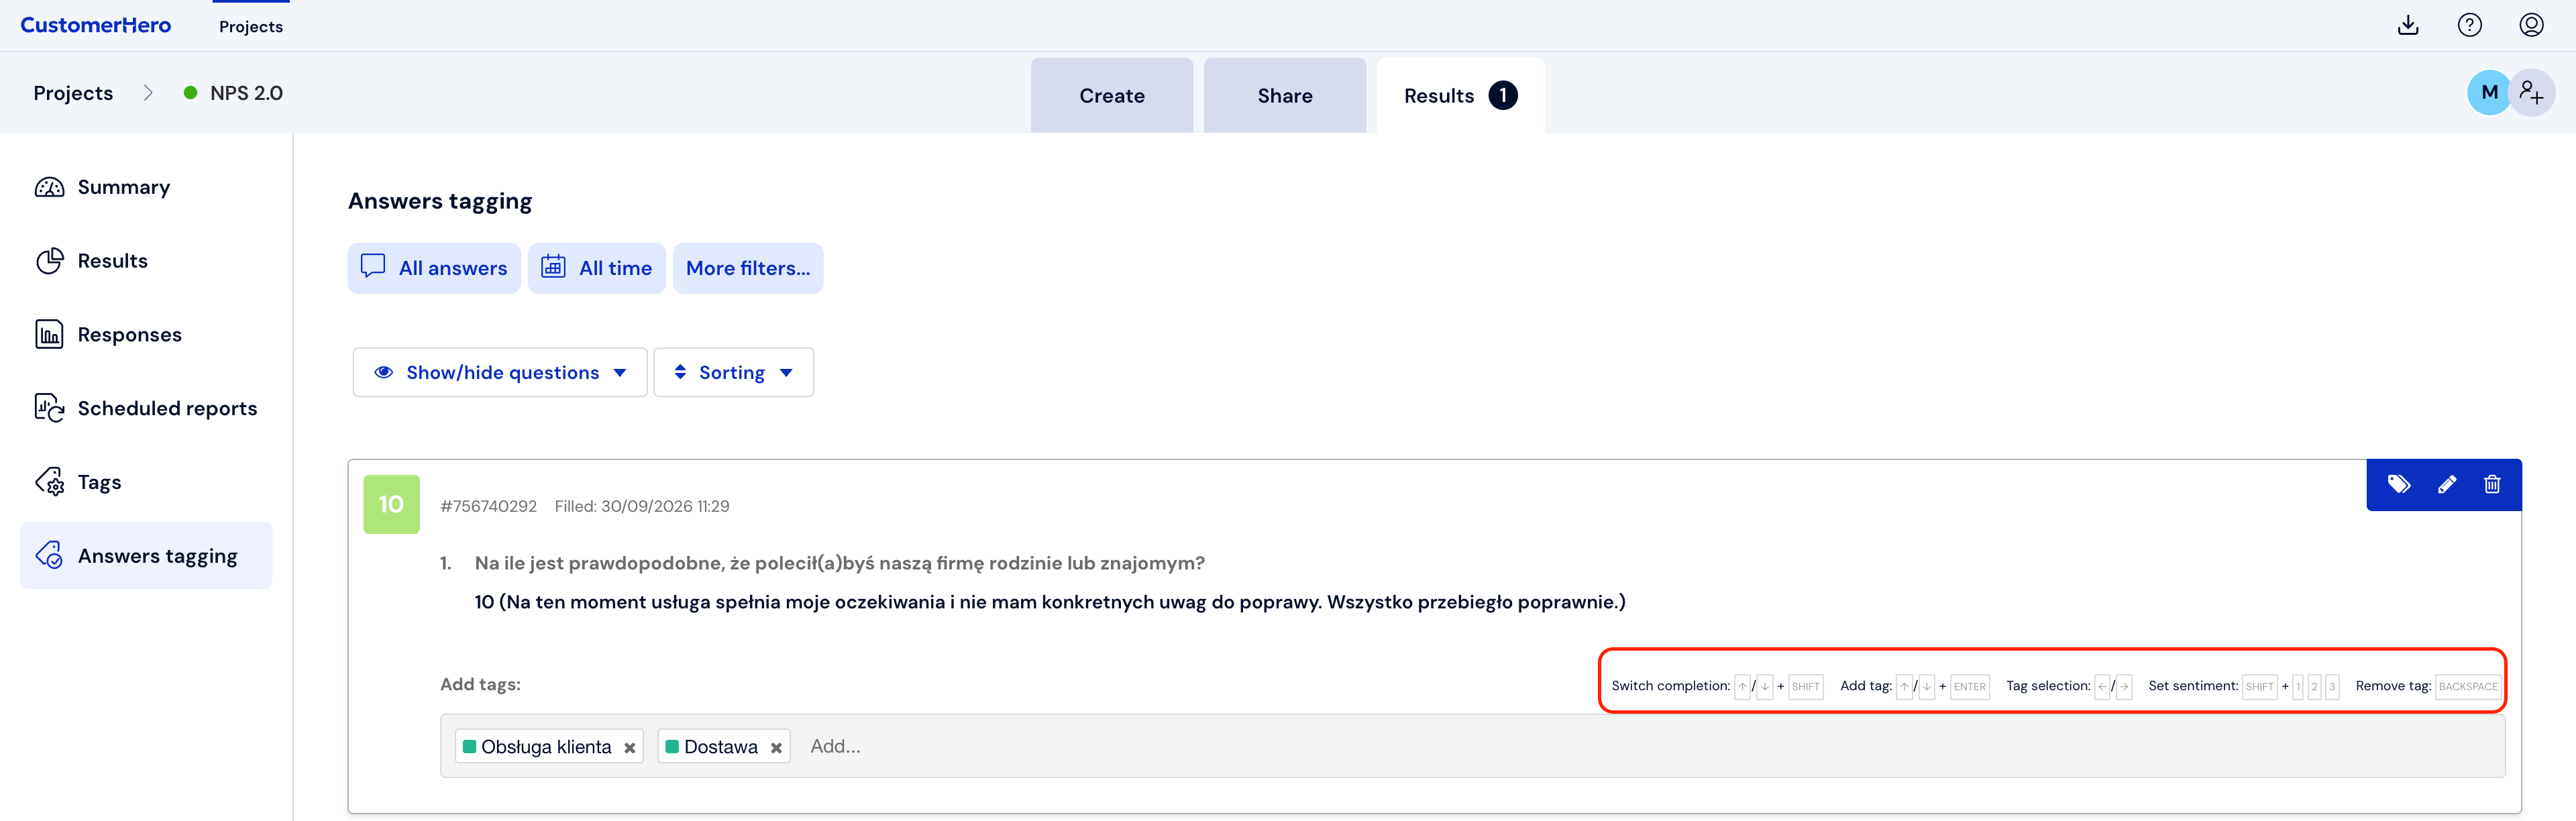
About 30 minutes of work using these shortcuts is enough for muscle memory to kick in:). Then the entire tagging process runs much faster than clicking with a mouse.
Next to each added tag, a cross will appear, with which you can remove a given tag from this completion at any time.
What is the optimal number of tags we should use?
Some of you are probably wondering what is the maximum number of tags we should add so that the subsequent analysis is as valuable as possible.
Certainly, the more tags, the more accurate, but it will be harder to perform such an analysis. In turn, fewer tags will make the analysis very general because we have general information.
The solution may therefore be to use general and detailed tags, e.g., we can create tags such as courier, but also courier-time, courier-contact (if we want to evaluate the delivery time and the service itself).
Having this type of tags, already at the analysis stage, we can choose whether we want to analyze them generally or in detail. At the beginning, about 20, max. 30 is probably enough.
On the other hand, it does not make much sense to create a tag for only 1 statement if we do not have several other similar ones. Then it is enough to add the tag "other" to such a statement.
Exporting tags
Once the respondents' statements have been tagged, you can proceed to download the data for a report with raw data.
To do this, go to the Results → Completions tab, and then click the Download raw data button.
In the next step, select the Export button and decide in which format you want to download the file — XLSX or CSV.
The assigned tags can be found in one of the last columns of the downloaded file:
[Important information]: In the raw data, it is not possible to export the marked statement sentiment. This means that even if a positive, neutral, or negative sentiment was assigned to a statement during analysis, this information will not be visible in the CSV or XLSX file after data export.
Next step? Quantitative analysis!
Have you already assigned the created tags to specific completions? Great! You still have the two most important tasks ahead of you – quantitative analysis of tags and sentiment analysis. In the next article regarding tagged responses, we will tell you how to carry out a quantitative analysis using advanced cross tables, rankings, and trends available on the CustomerHero platform. In other words – how to find out what our customers say about our prices, customer service, product, etc., which areas are rated best and which worst, and which of the touchpoints on the customer-company line require our attention and improvement.