
Analysis of Open-Ended Responses - Tags and Sentiment
Qualitative data analysis, such as respondents' comments and emotions towards a brand, enables the effective transformation of subjective opinions into valuable quantitative conclusions. This allows for a better understanding of content, such as customer feedback or remarks, and the identification of key topics and trends.
Cross-tabulation with a tag
Cross-tabulations with tags provide key information, helping to understand which areas require improvement and which distinguish the brand in the eyes of customers.
Cross-tabulating questions with tags is possible for NPS, rating, single and multiple choice, single choice matrix, rating matrix, list, and drag-and-drop questions.
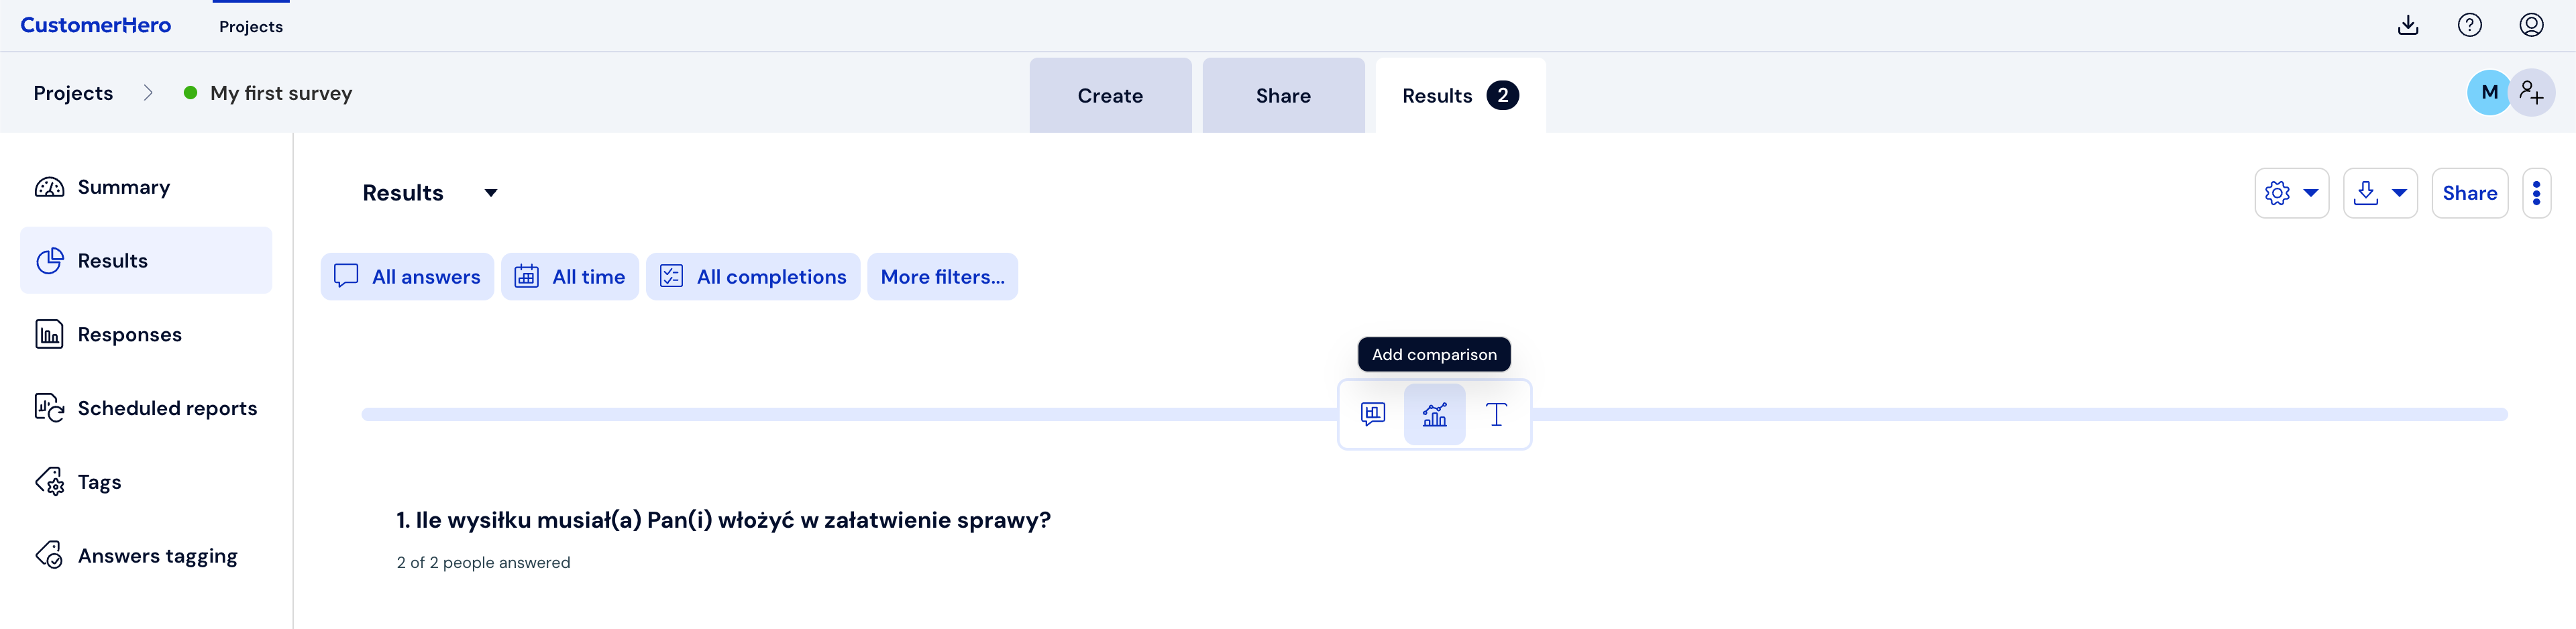
To create a cross-tabulation table, go to the Results tab and select Add comparison, which is available before and after each question.
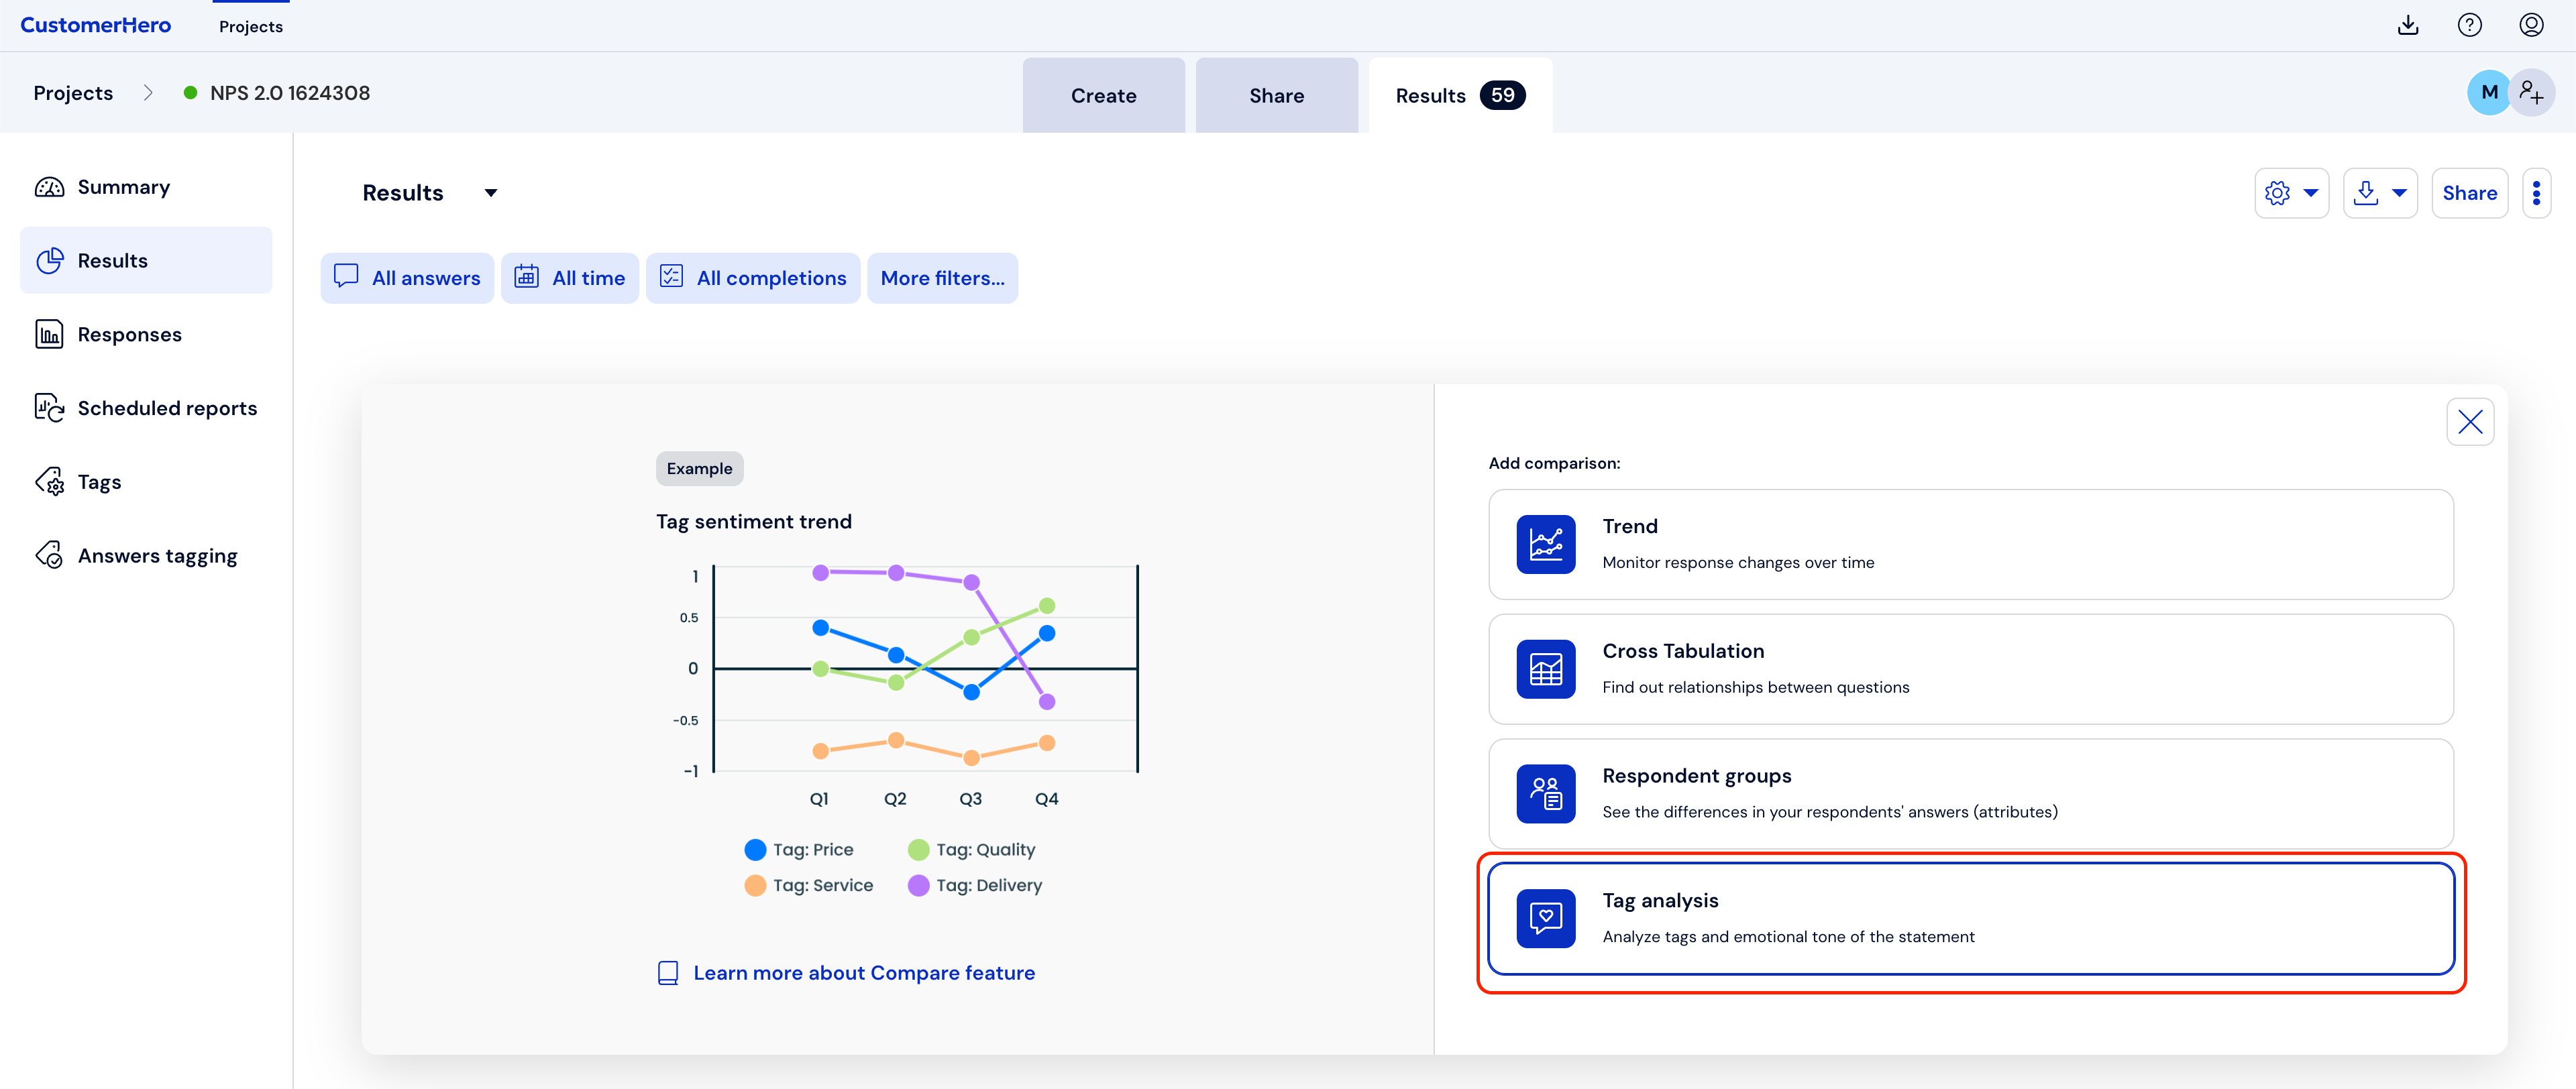
Select Tag analysis.
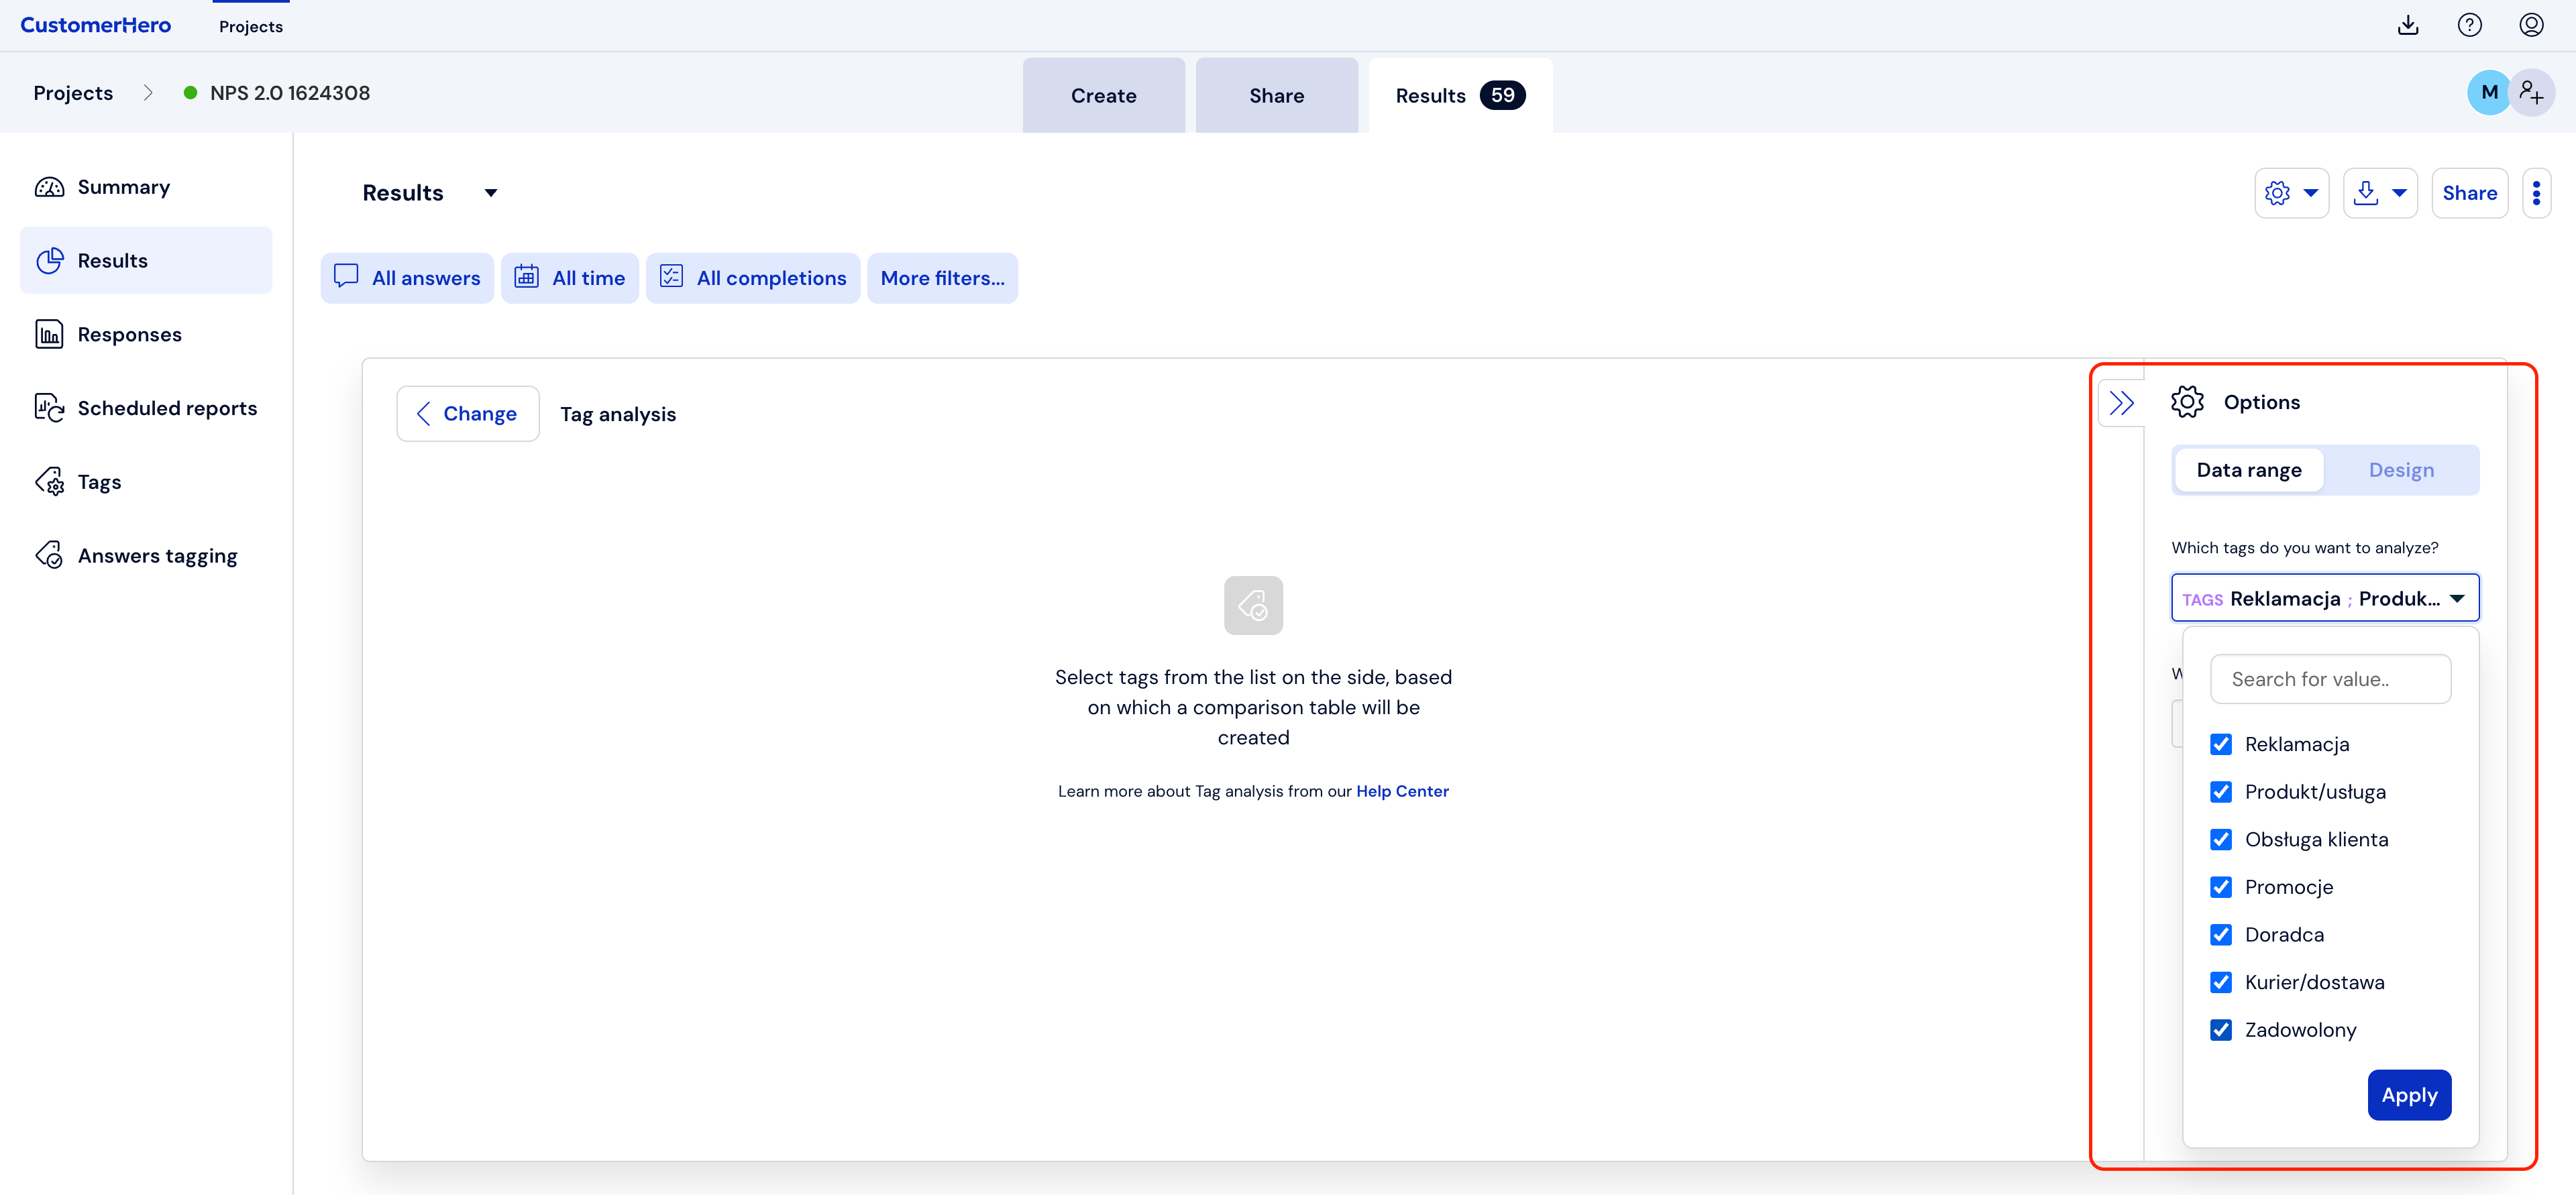
Options for selecting the data range of your cross-tabulation table will appear in the window on the right. Select which tags you want to analyze by searching for them on the list or entering the tag value in the search field.
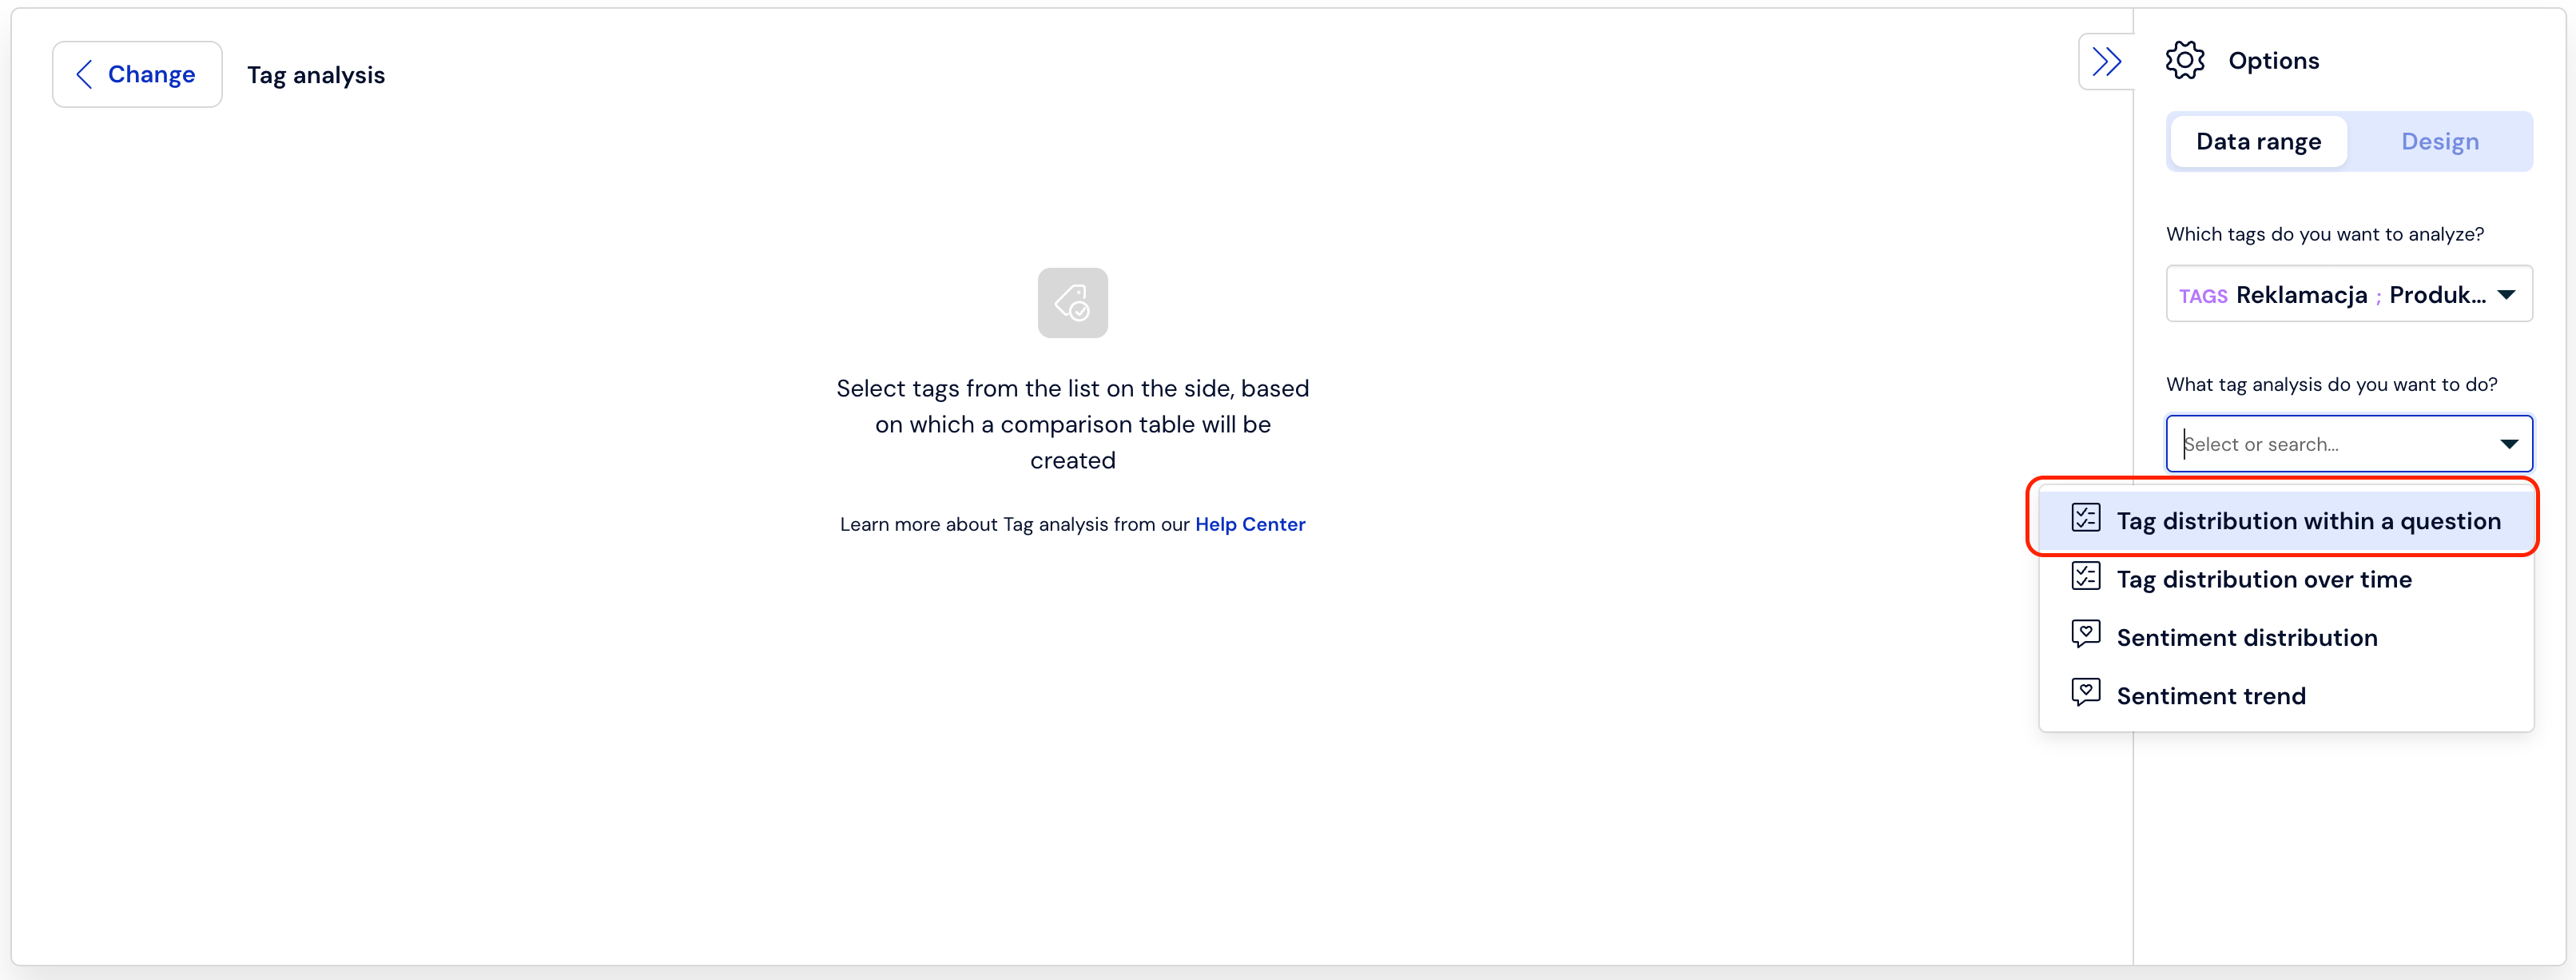
Choose what kind of tag analysis you want to perform. In the case of a cross-tabulation table, it will be the occurrence of tags in a question. Then select the question you want to compare.
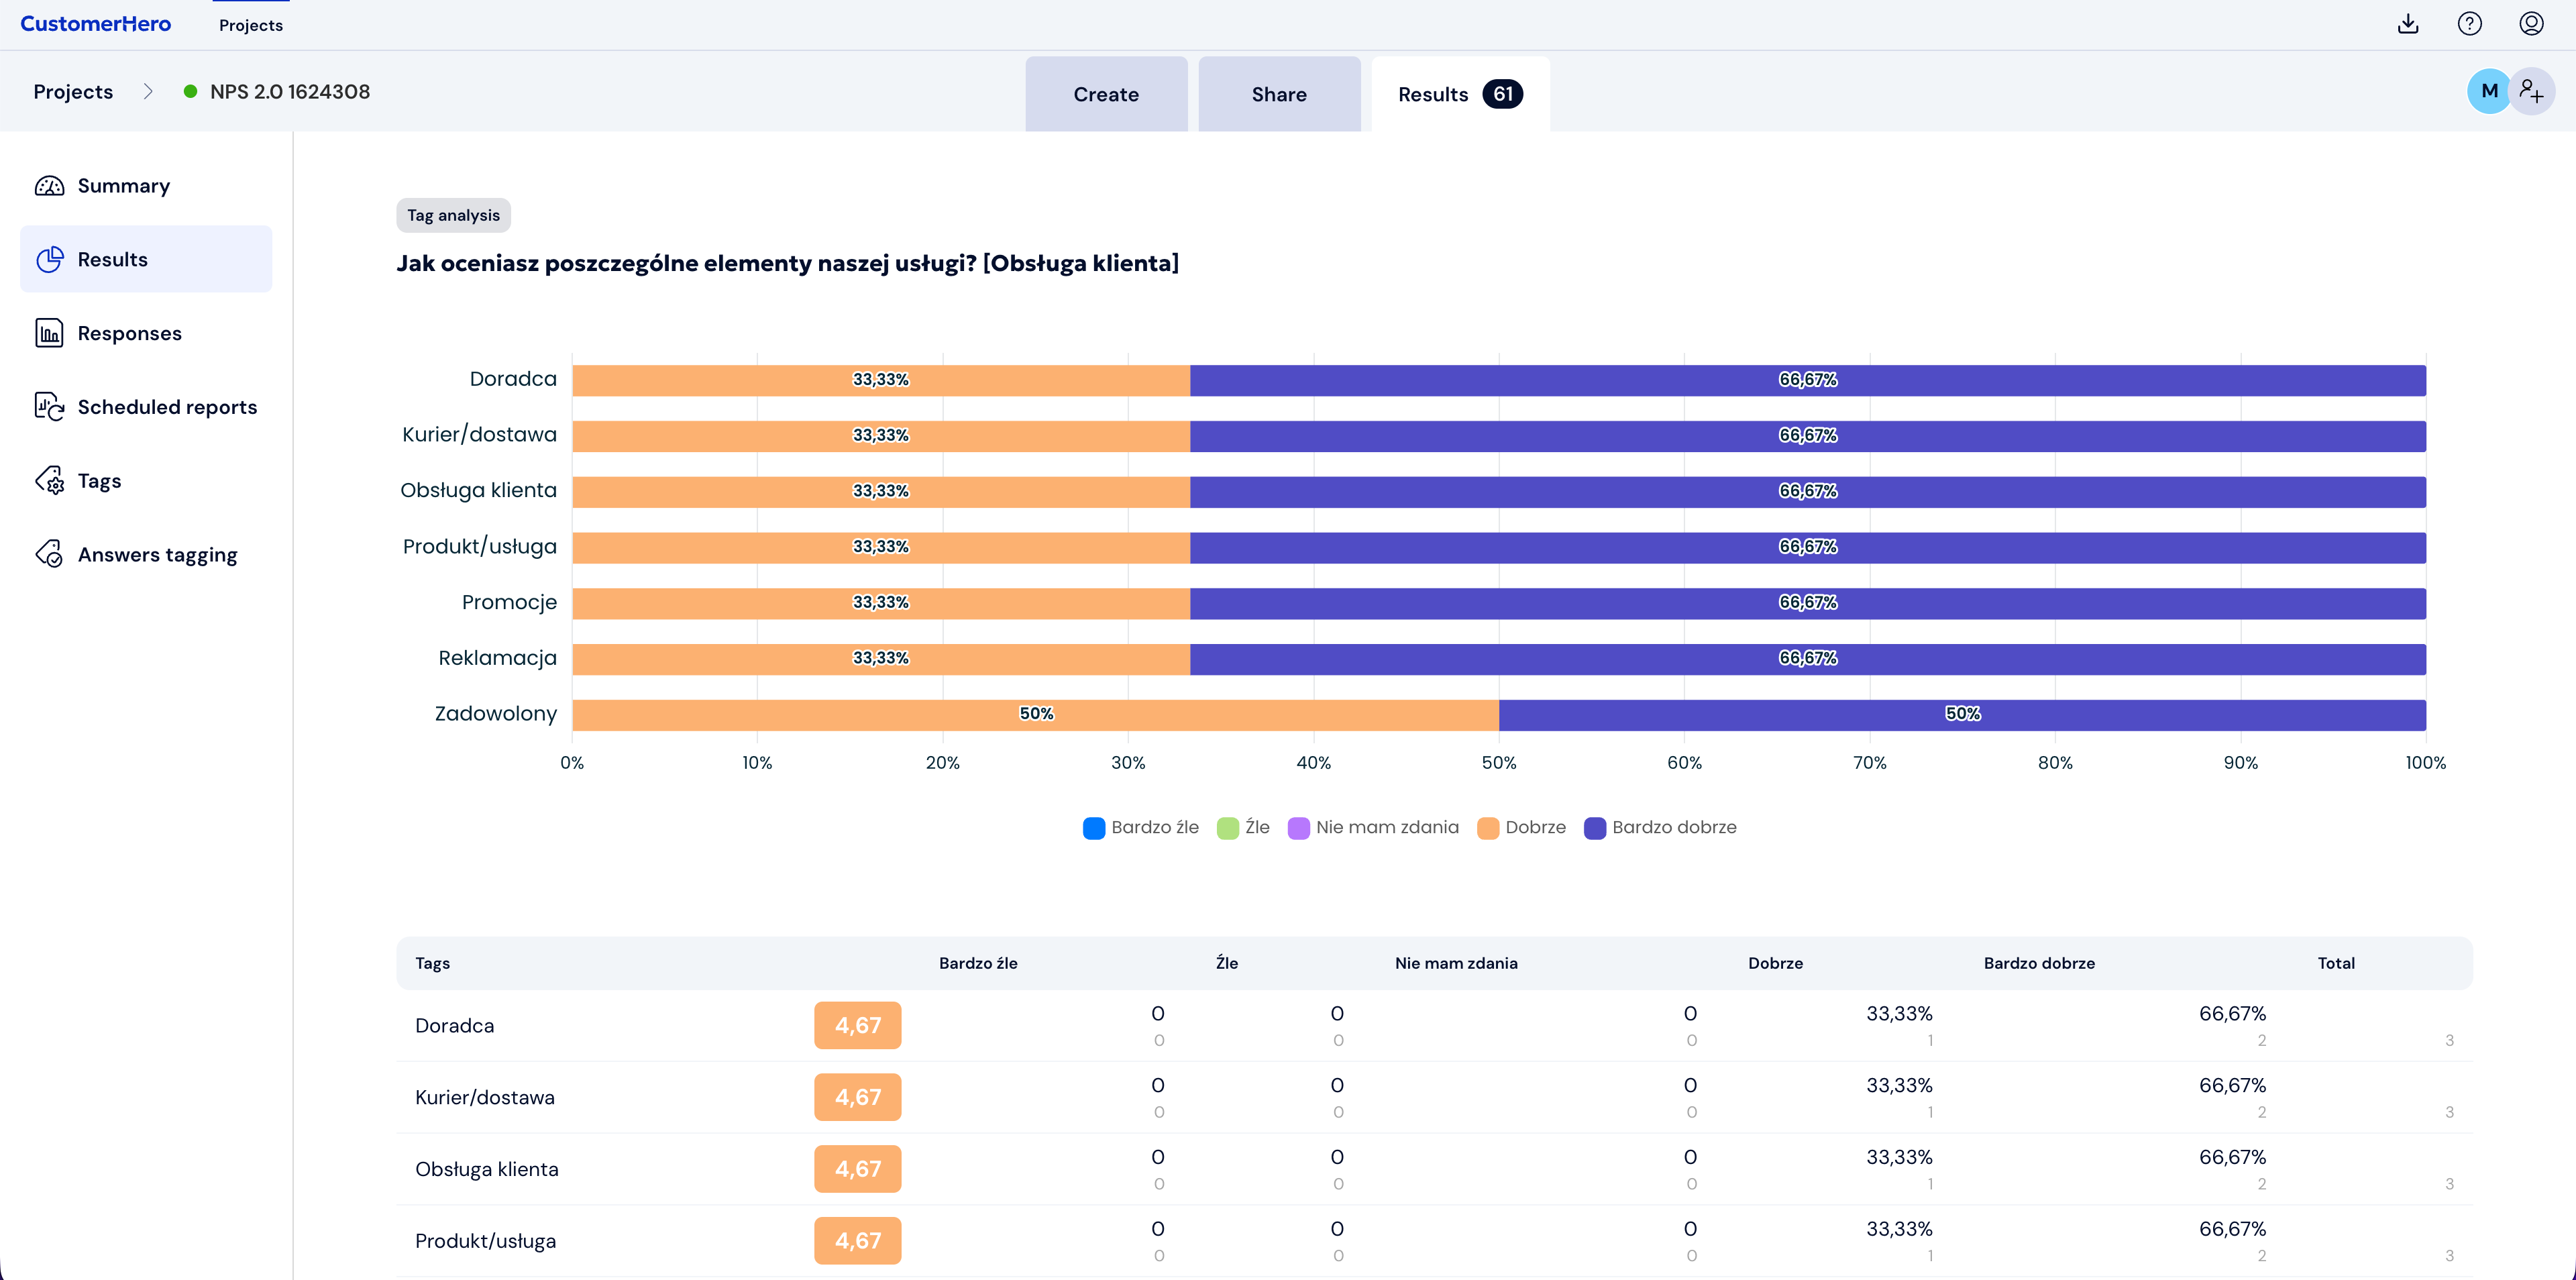
A chart will appear showing the relationship between the selected question and tags. There are small arrows in each column of the table that allow you to sort the data.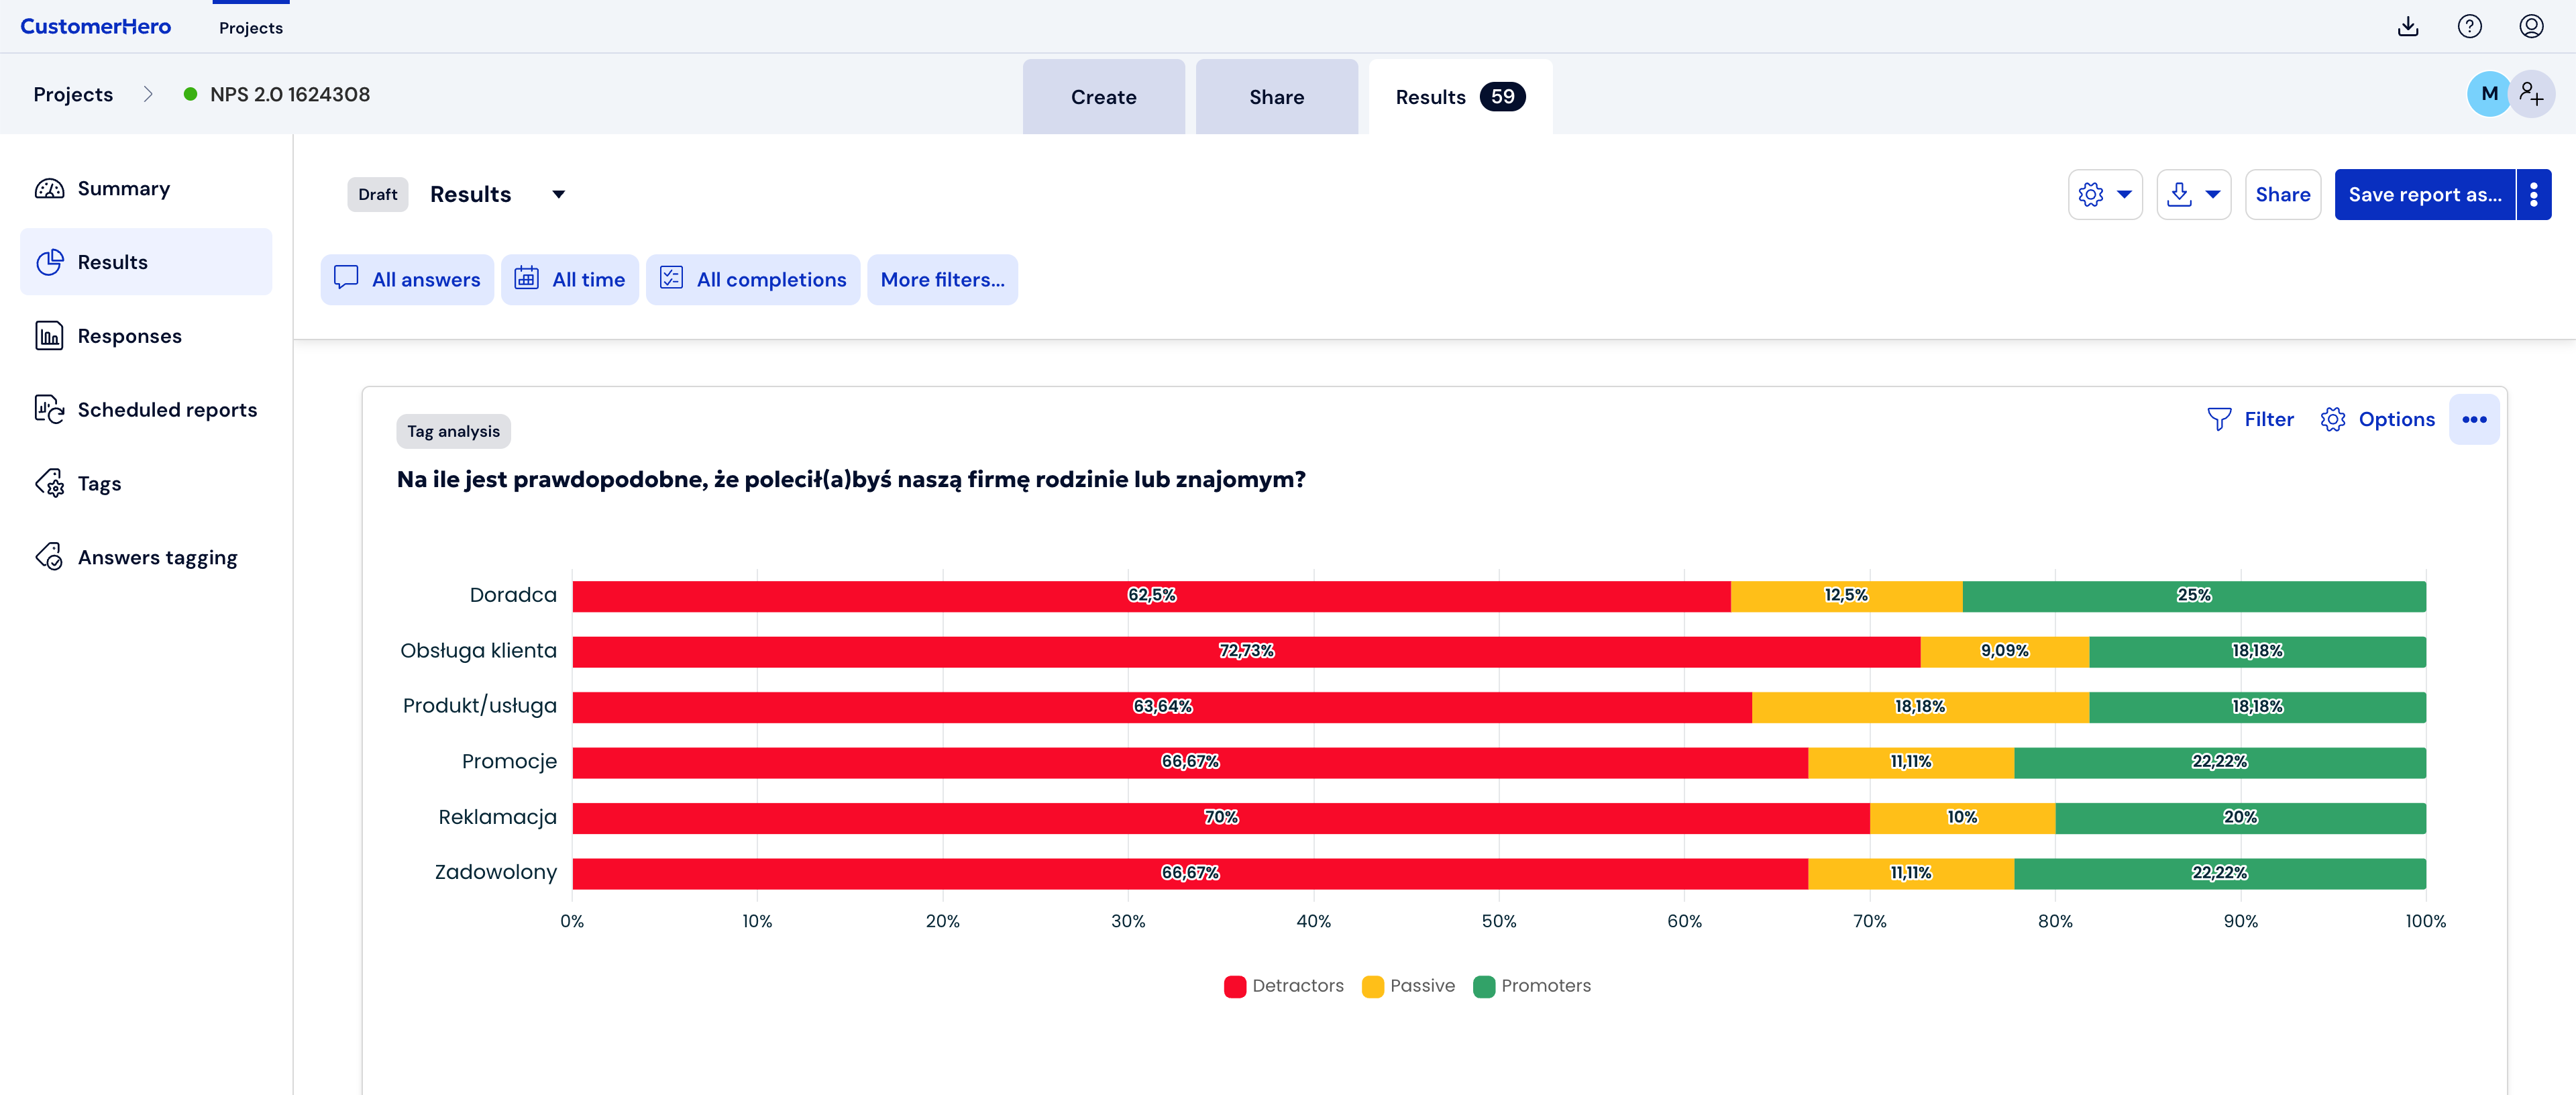
For matrix or rating type questions, the table also includes a weighted average.
Occurrence of tags over time
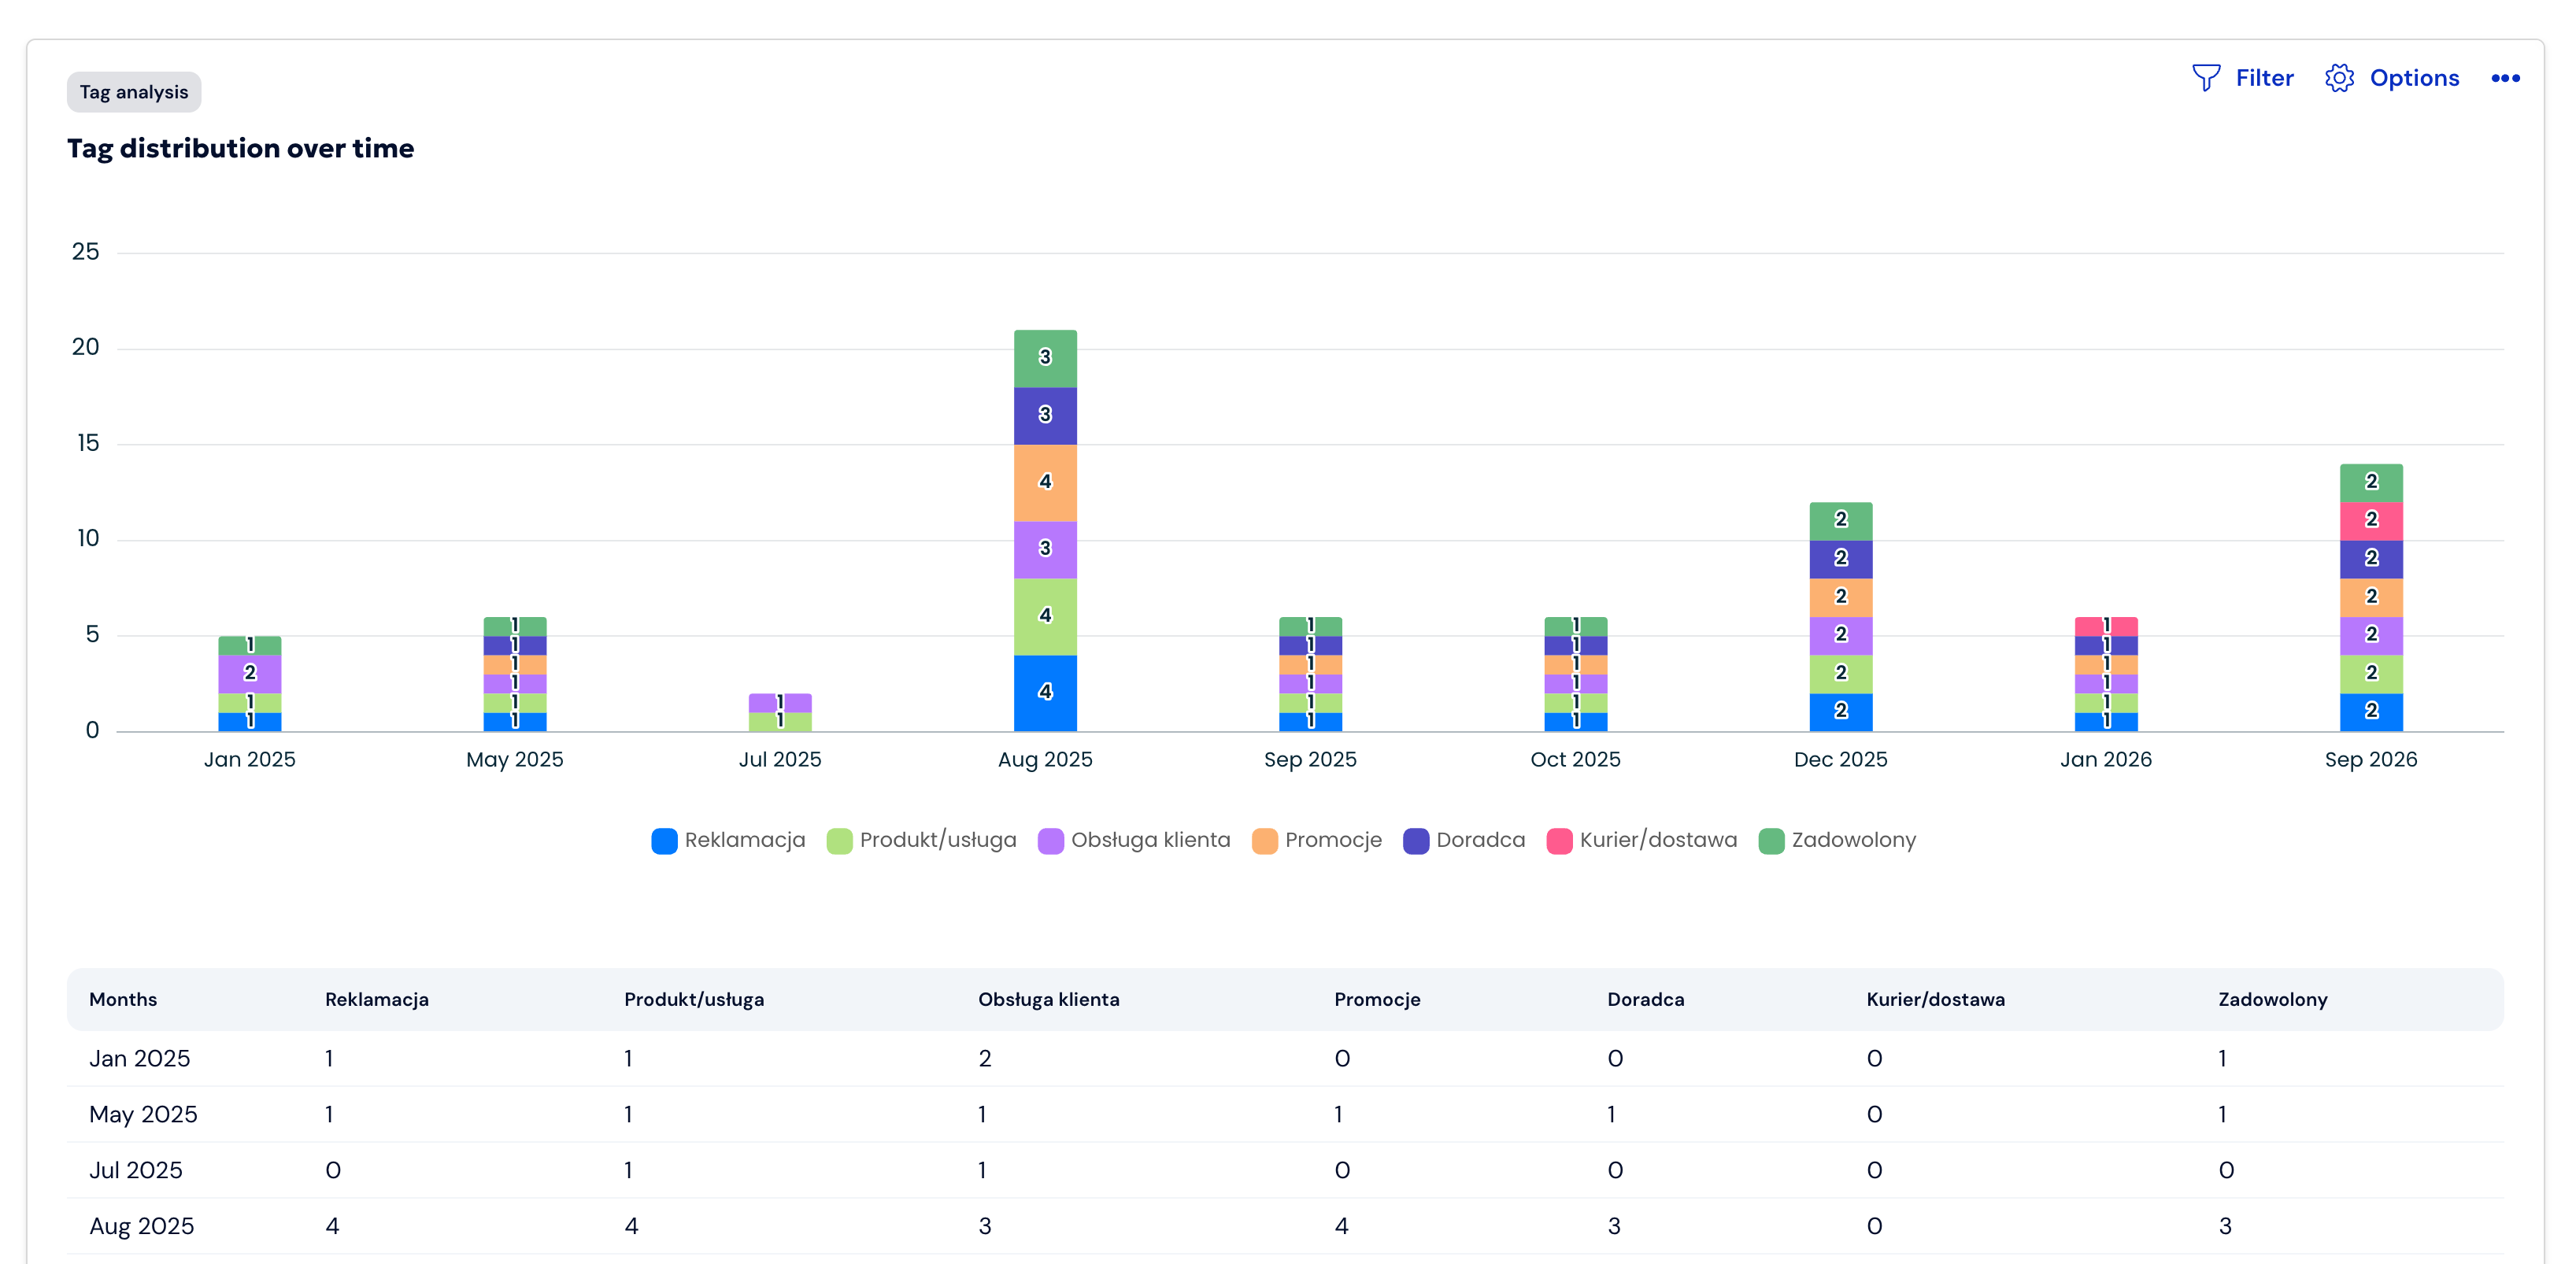
Analysis of tag occurrence over time allows you to see how often a given topic (tag, e.g., price, quality) was mentioned in different time intervals - weeks, months, or quarters. Thanks to this, we can track changes in interest in individual tags and determine their share in the total responses of respondents.
Go to the Results tab and select Add comparison, which is available before and after each question. Then select Tag analysis.
Select which tags you want to analyze by searching for them on the list or entering the tag value in the search field.
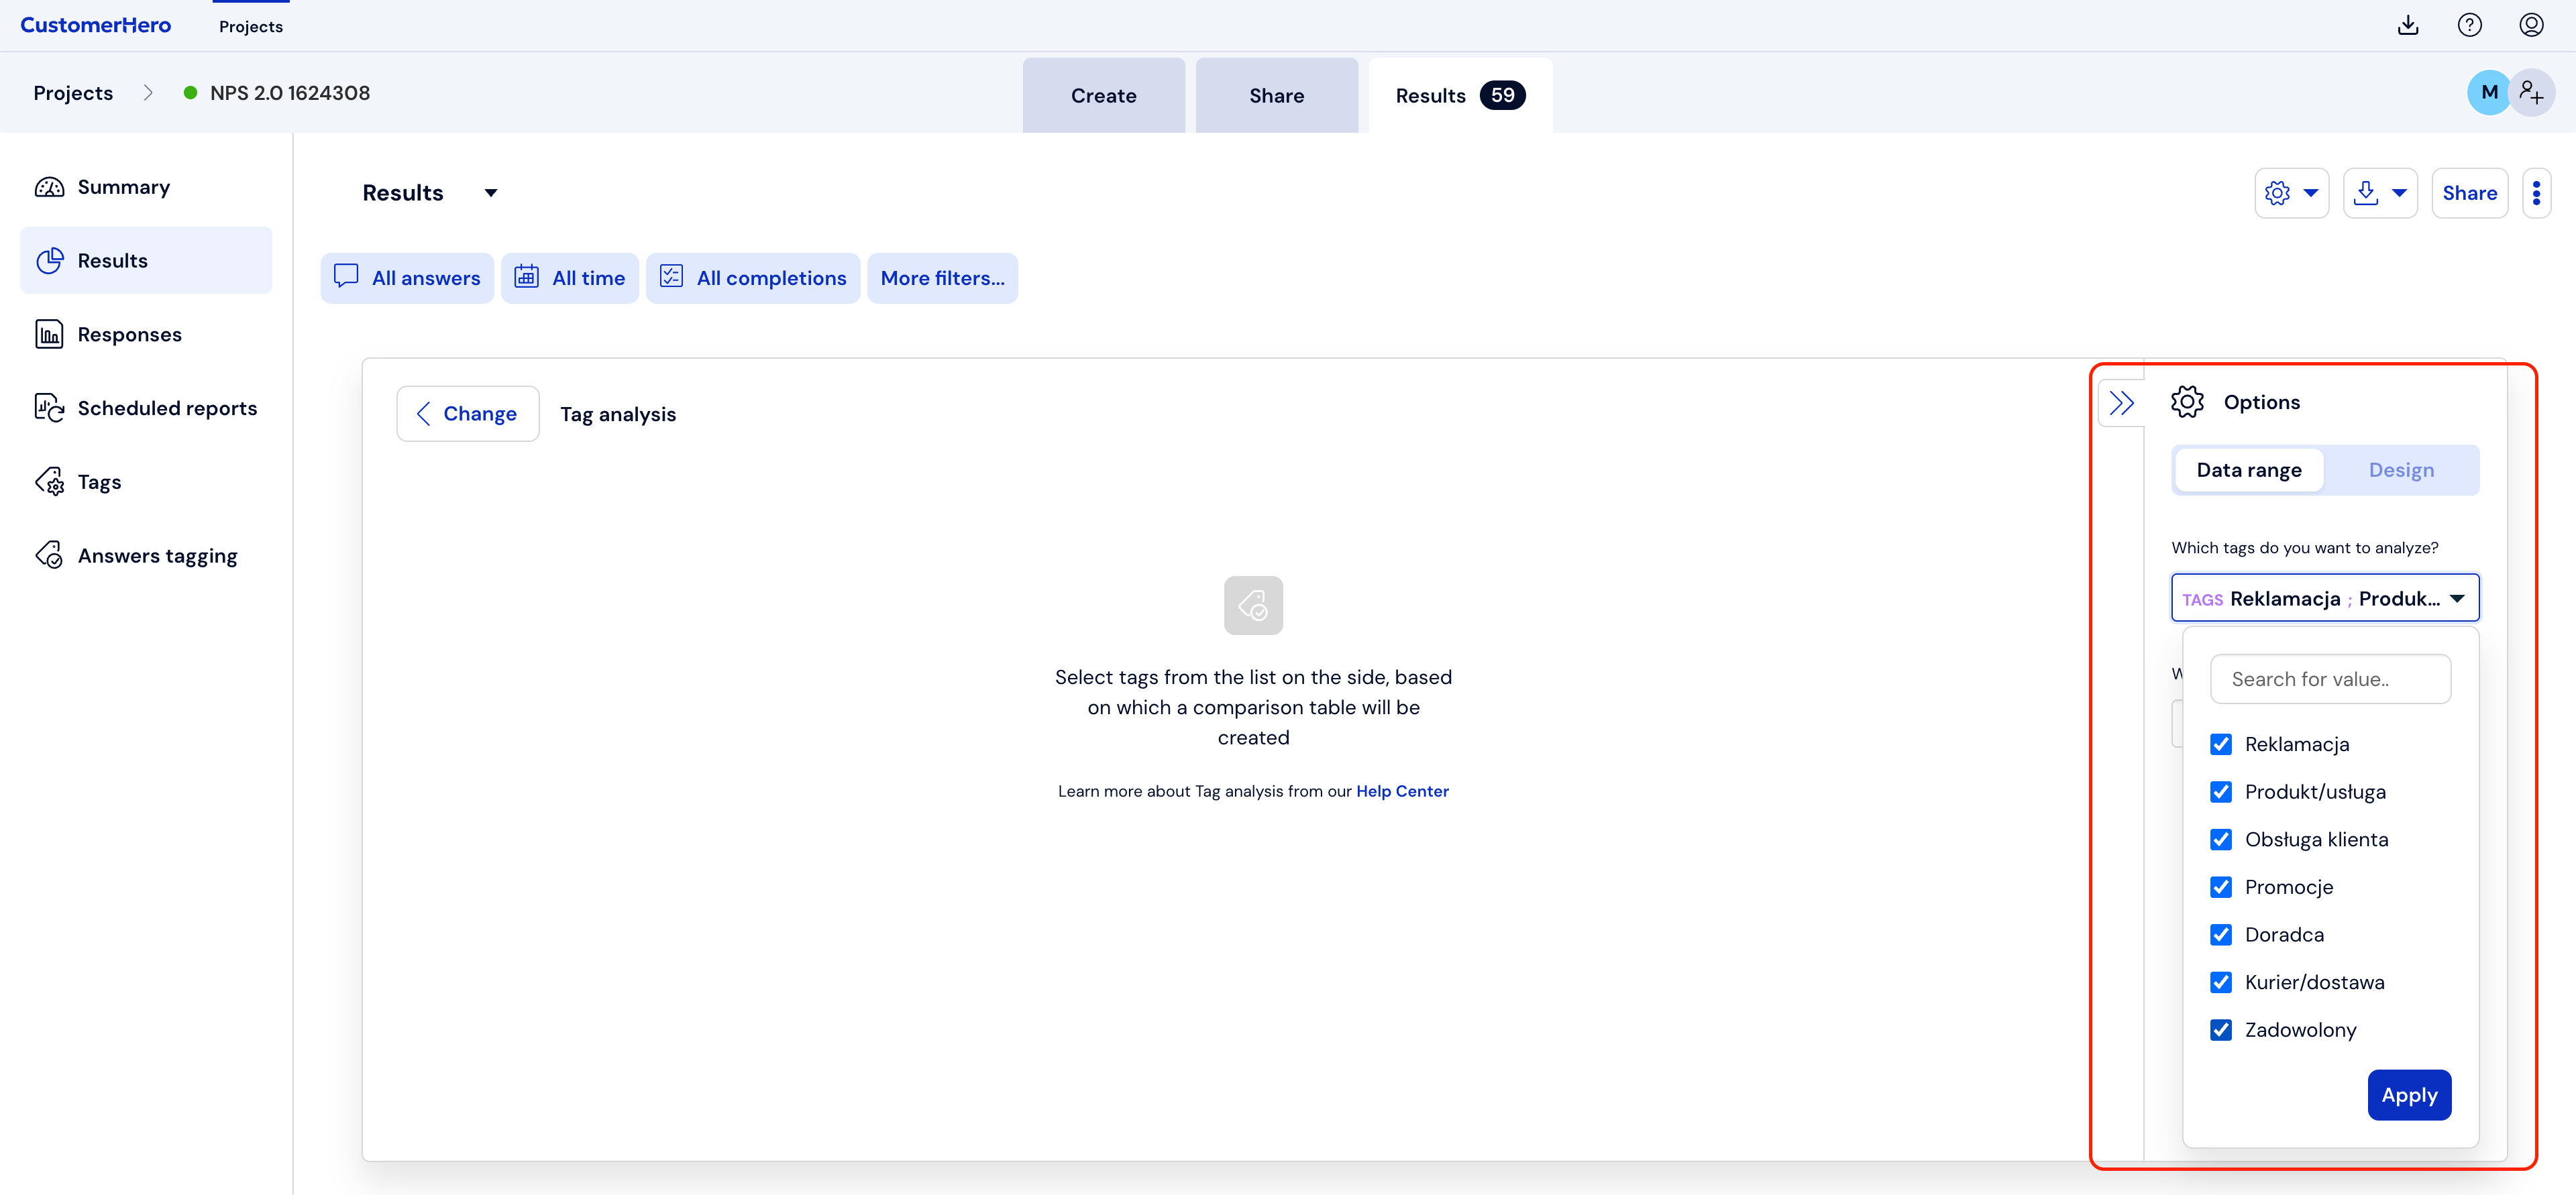
Choose what kind of tag analysis you want to perform. In this case, it will be the occurrence of tags over time.
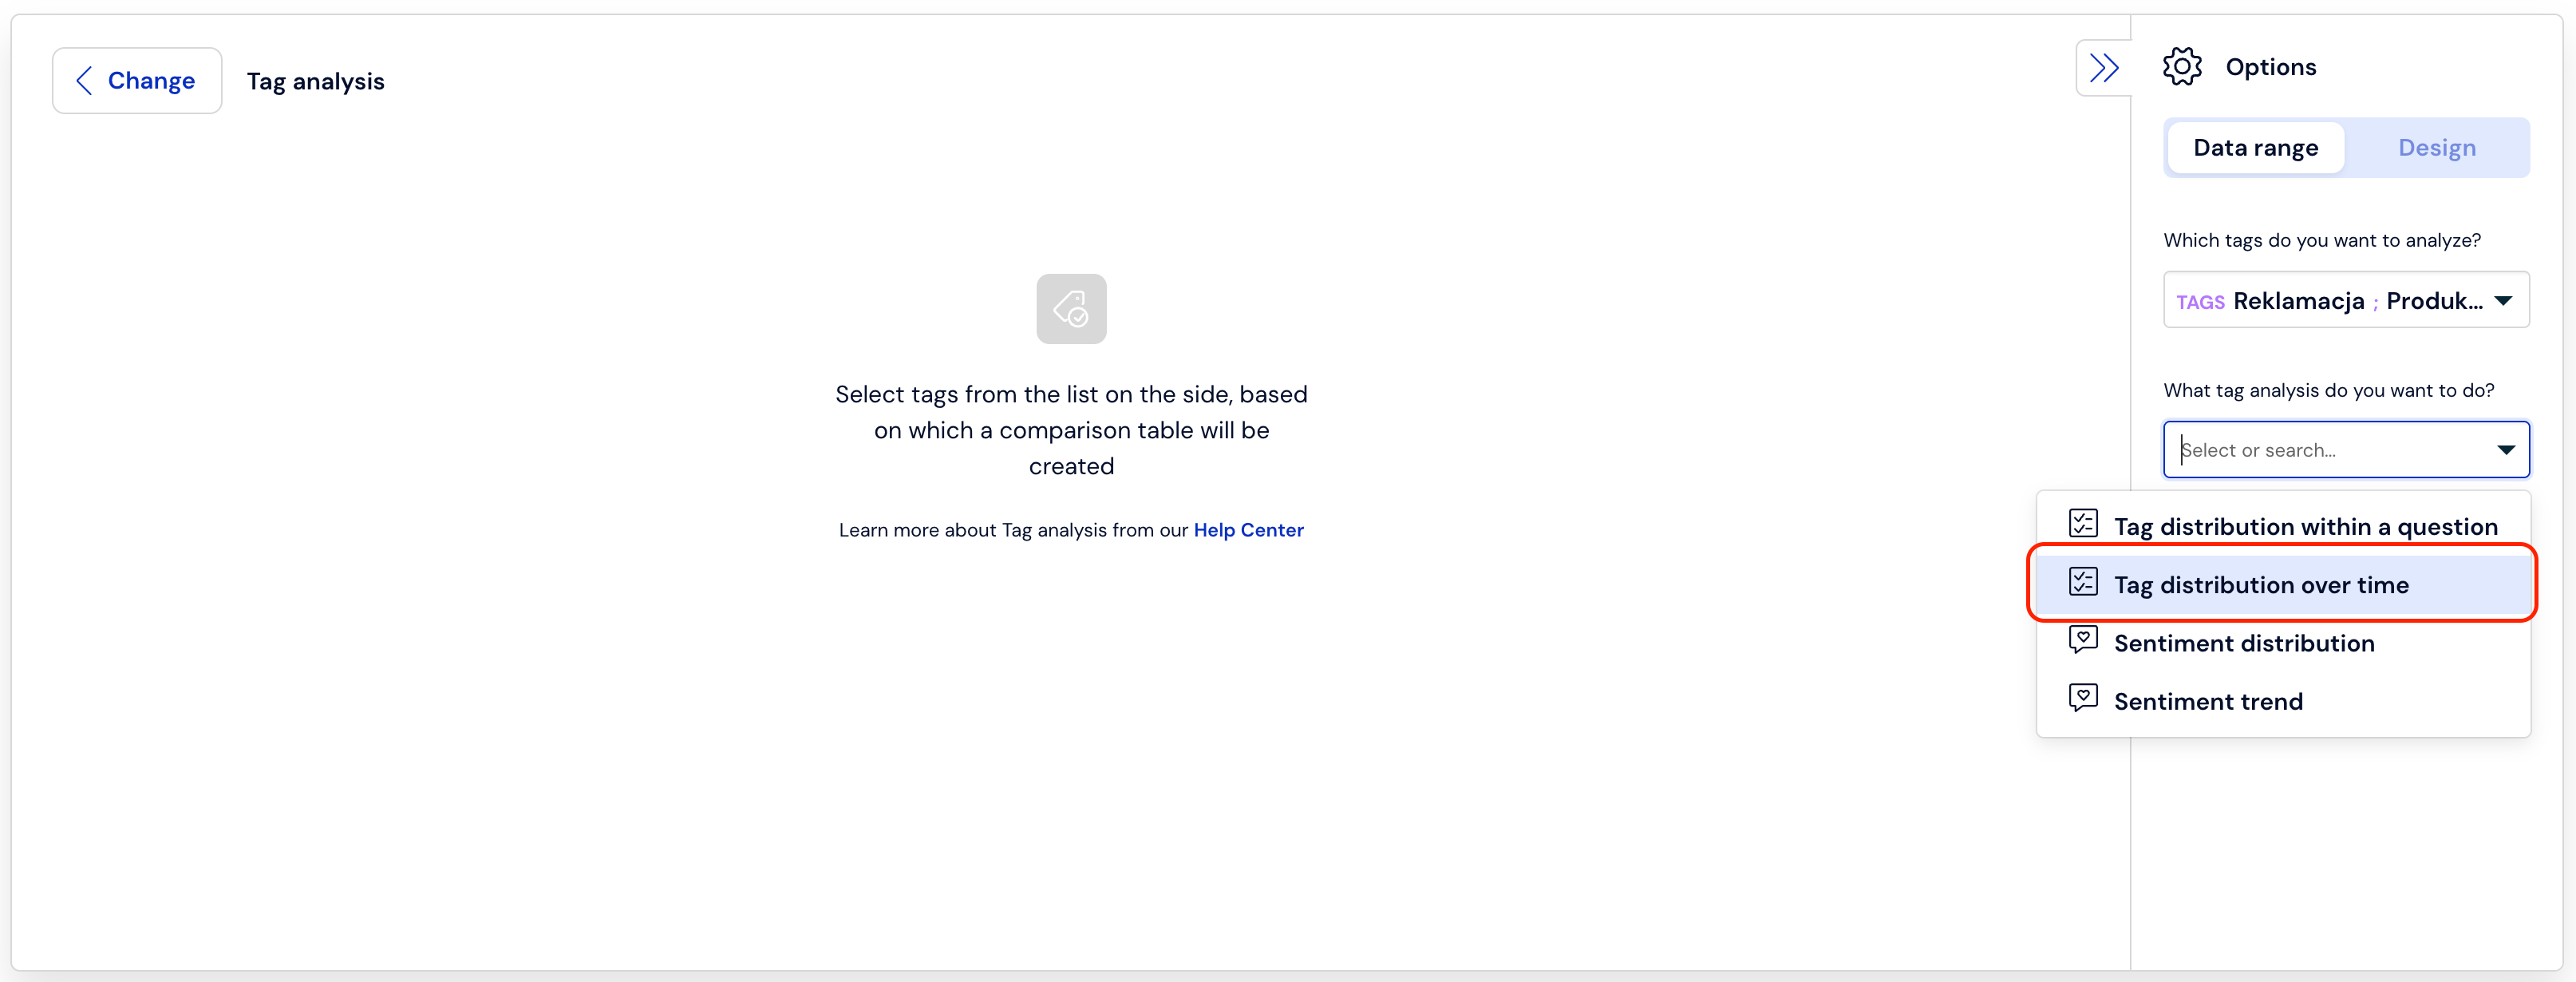
Choose how you want to group the responses, you can choose the entire survey period or a specific range.
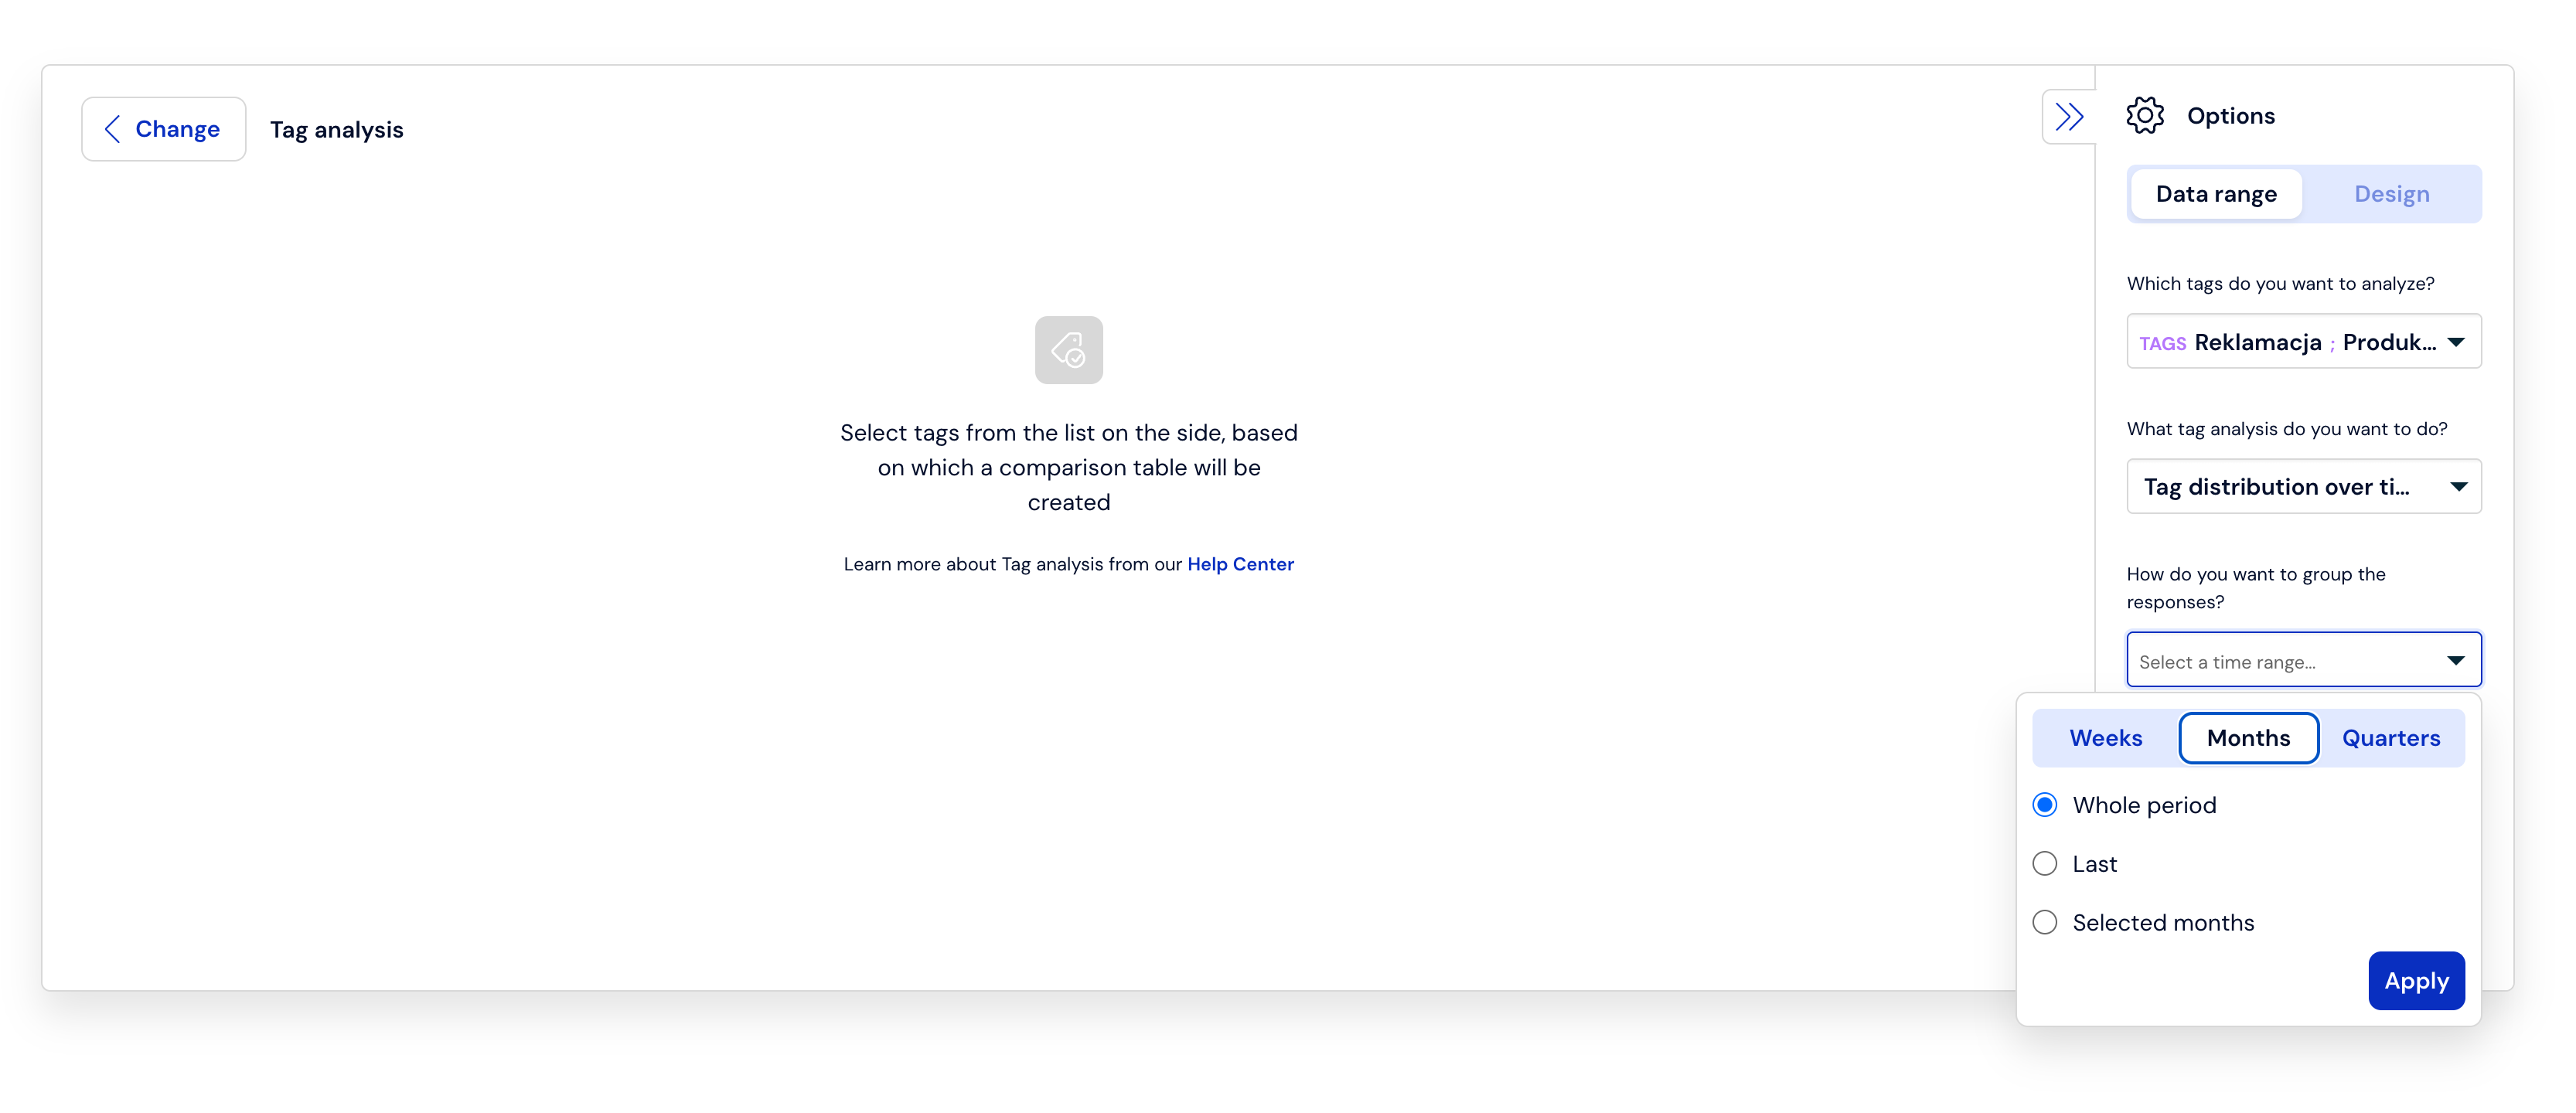
A chart will appear showing the quantitative distribution of tags in the selected time range. There are small arrows in each column of the table that allow you to sort the data.
Sentiment distribution
Sentiment distribution analysis allows you to understand how respondents talk about a given topic (e.g., price, product quality, customer service). Thanks to this, we can determine whether the statements are positive, negative, or neutral, which gives a more complete picture of respondents' opinions.
Go to the Results tab and select Add comparison, which is available before and after each question. Then select Tag analysis.
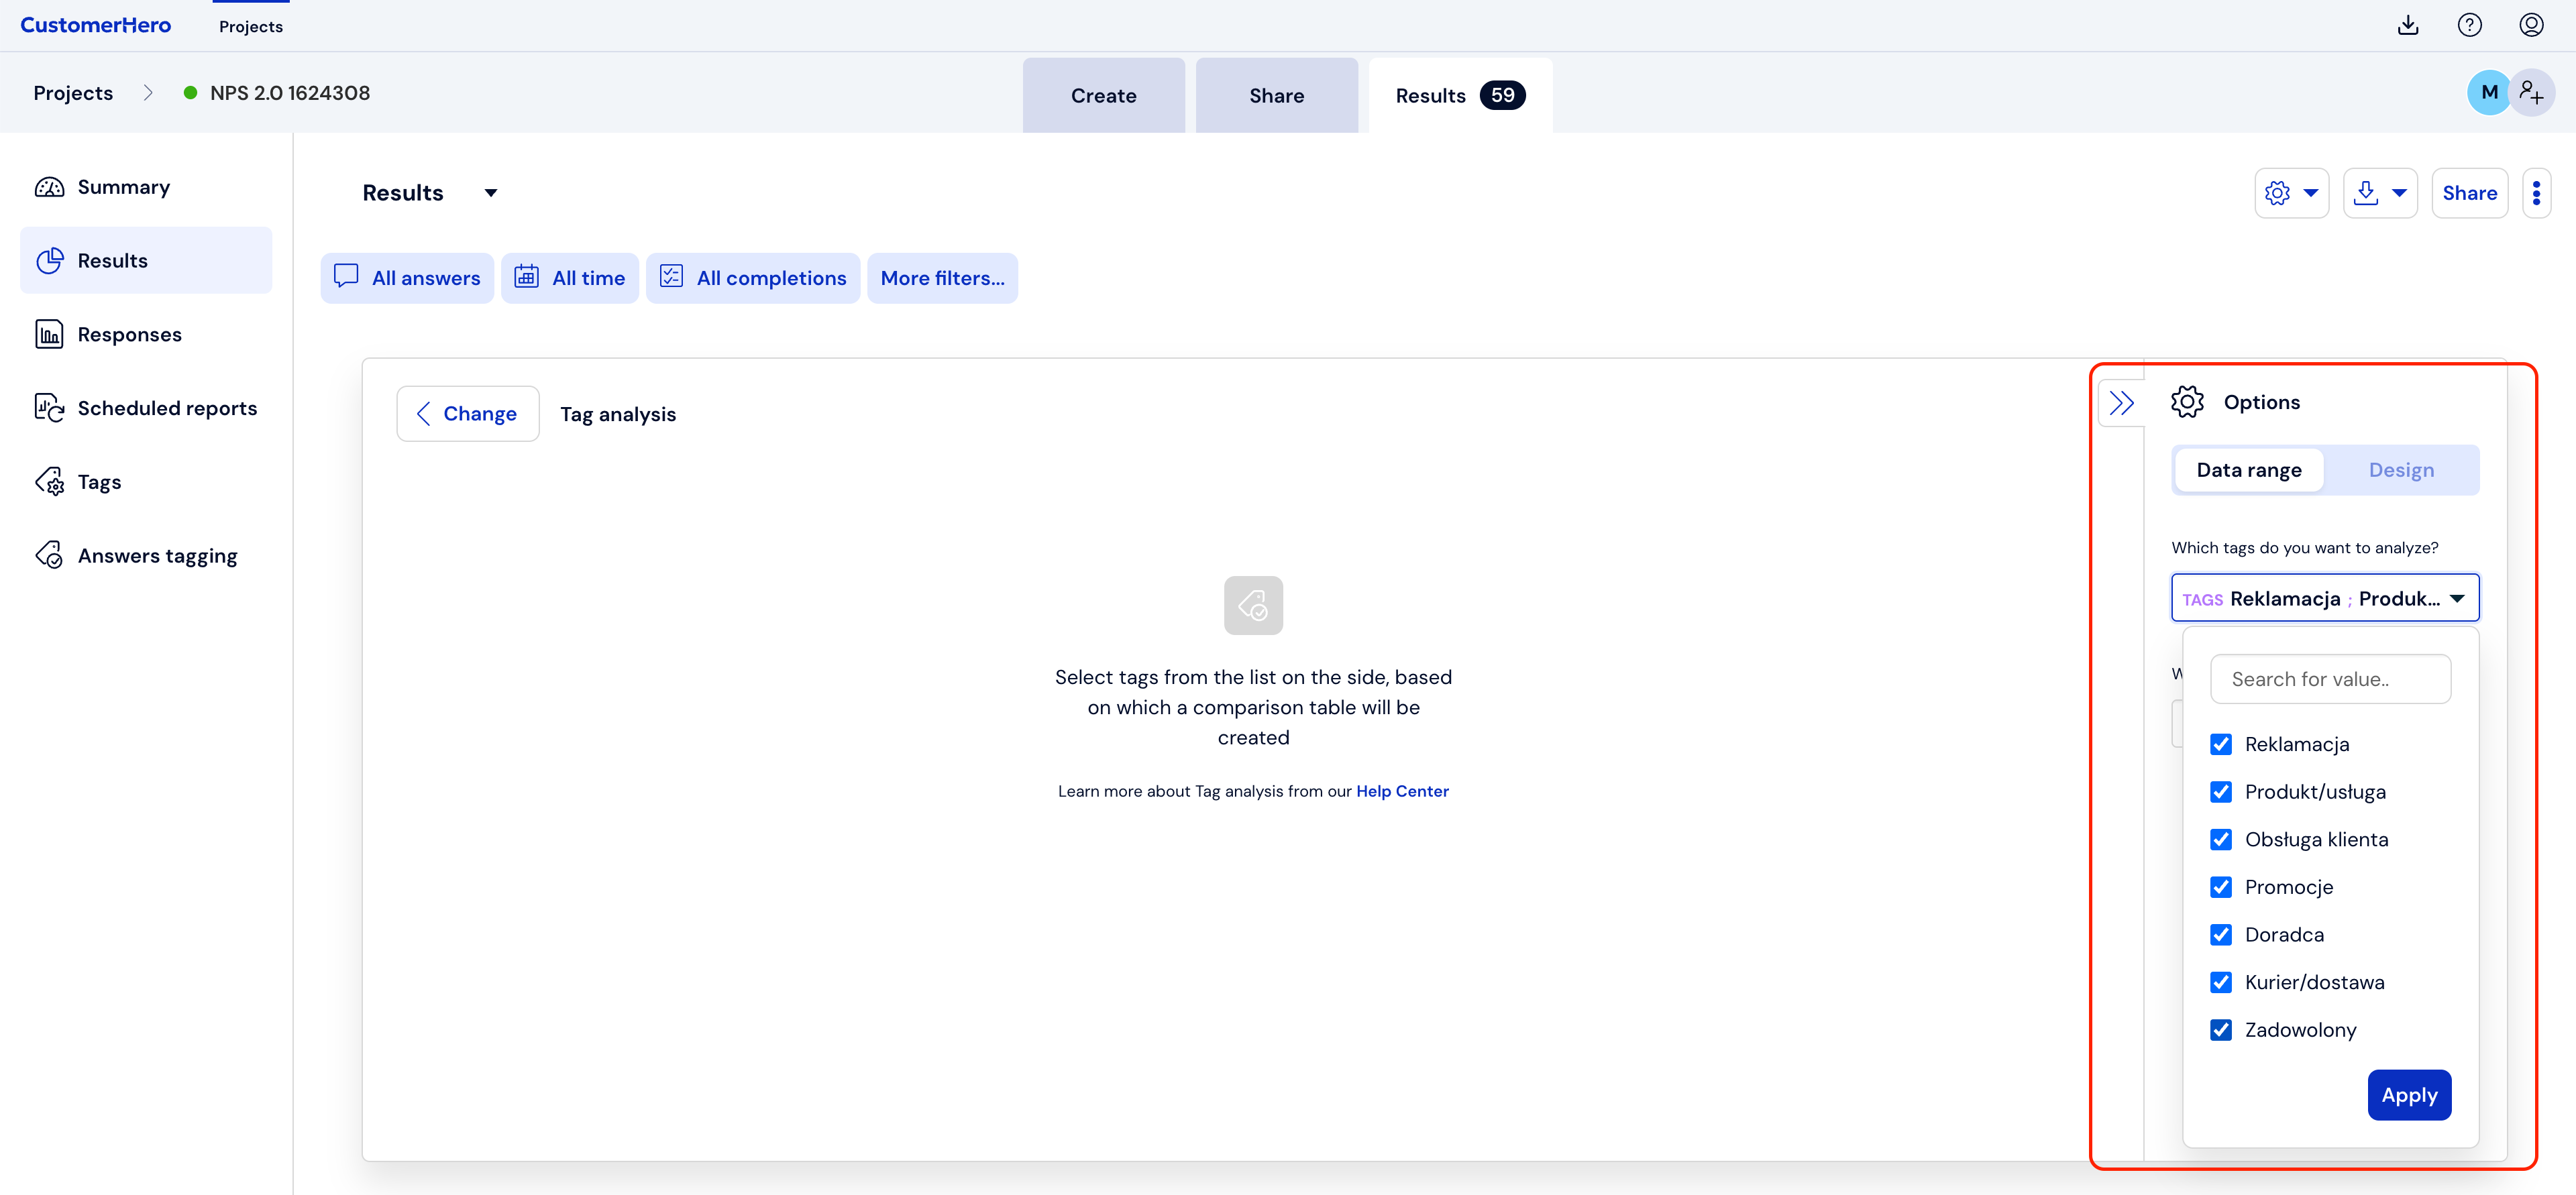
Select which tags you want to analyze by searching for them on the list or entering the tag value in the search field.
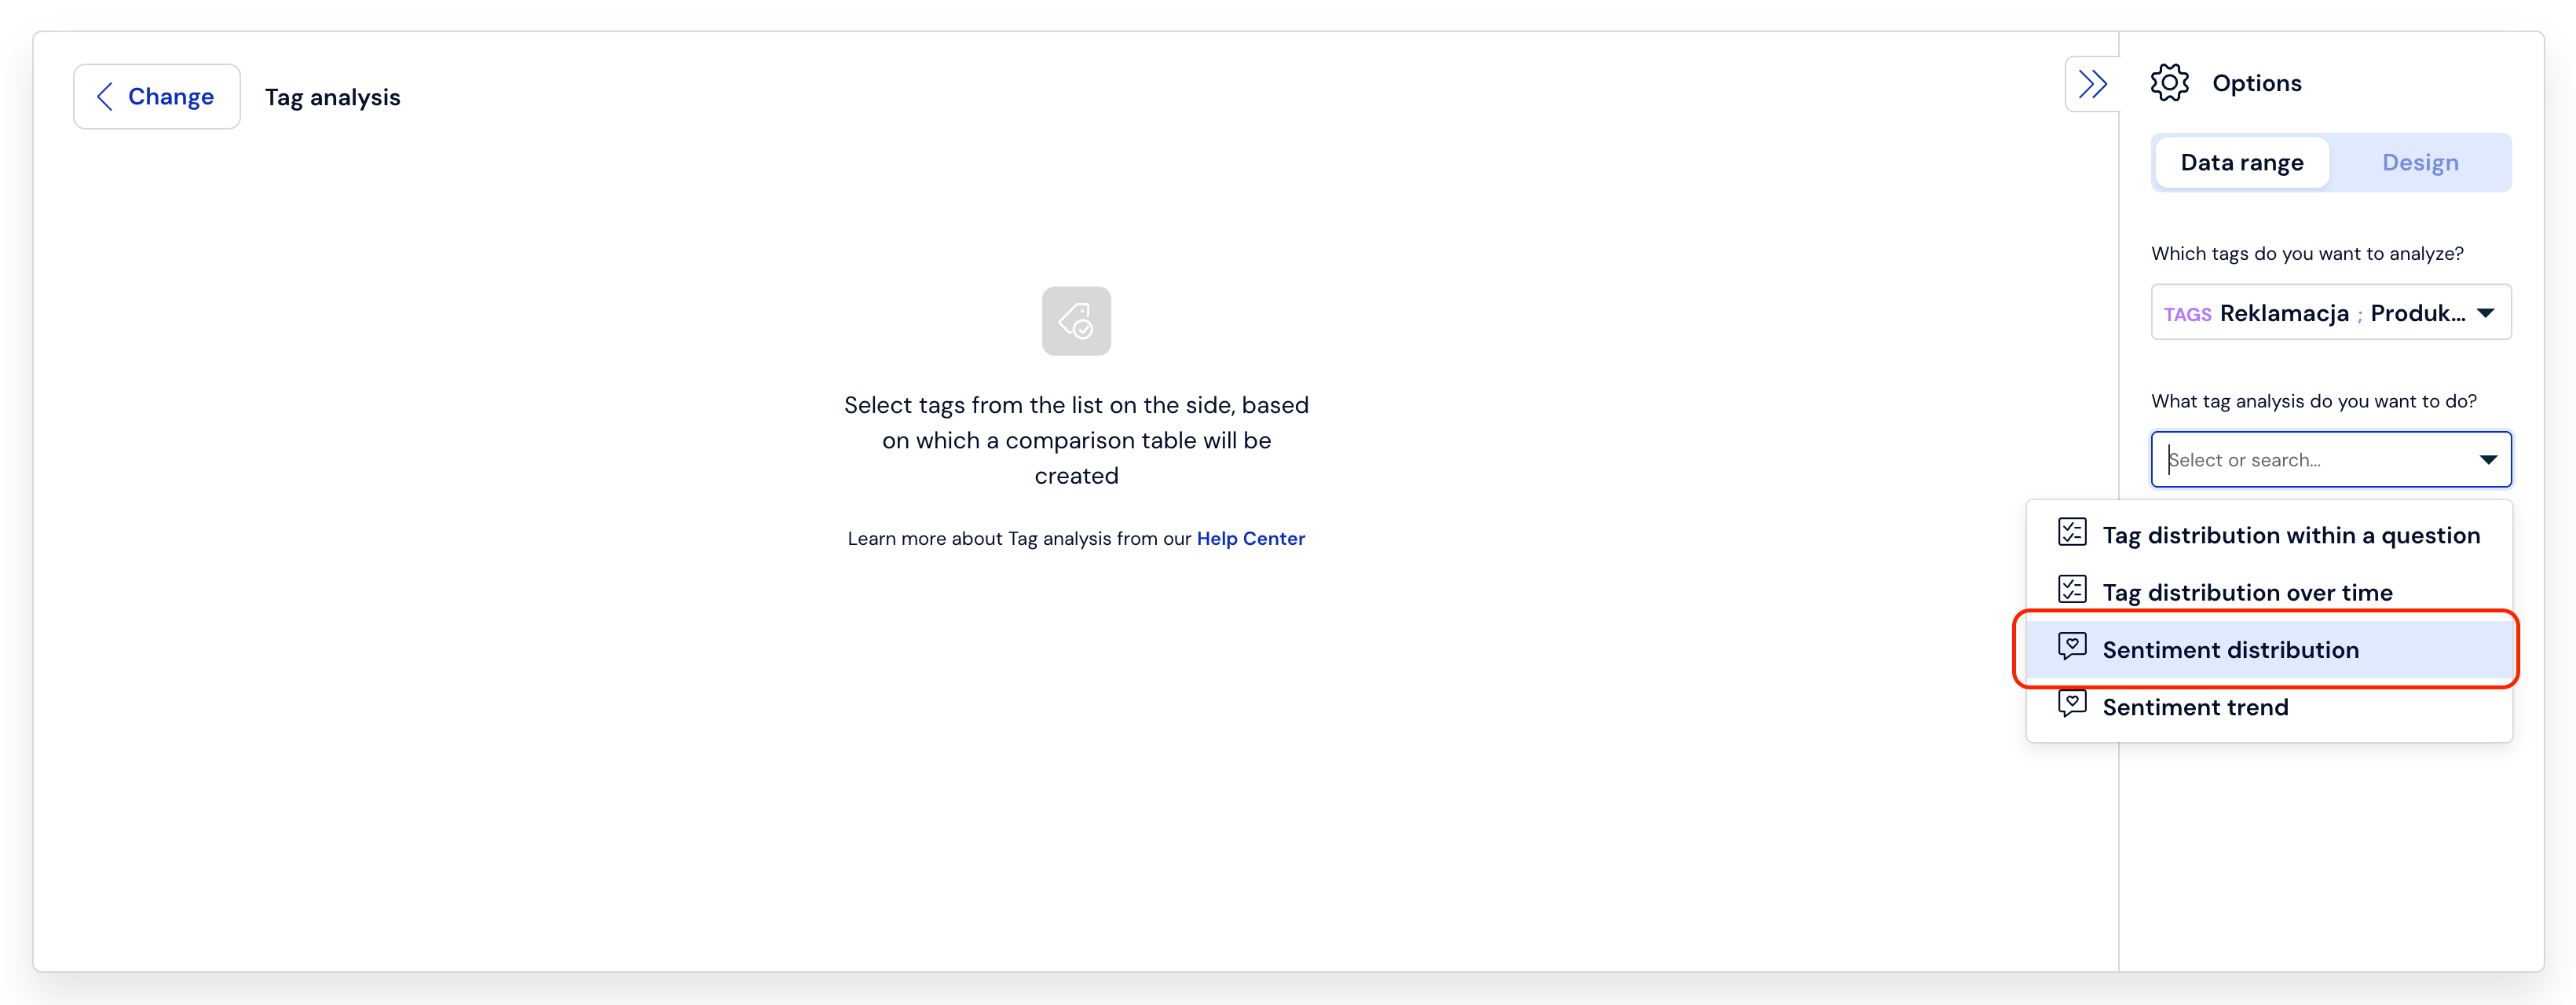
Choose what kind of tag analysis you want to perform. In this case, it will be the sentiment distribution.
A chart will appear showing the distribution of sentiment occurrences for each tag. There are small arrows in each column of the table that allow you to sort the data. The table also includes the Sentiment Score value, which is the sentiment average, on a scale from 1 to -1, where 1 means fully positive and -1 fully negative.
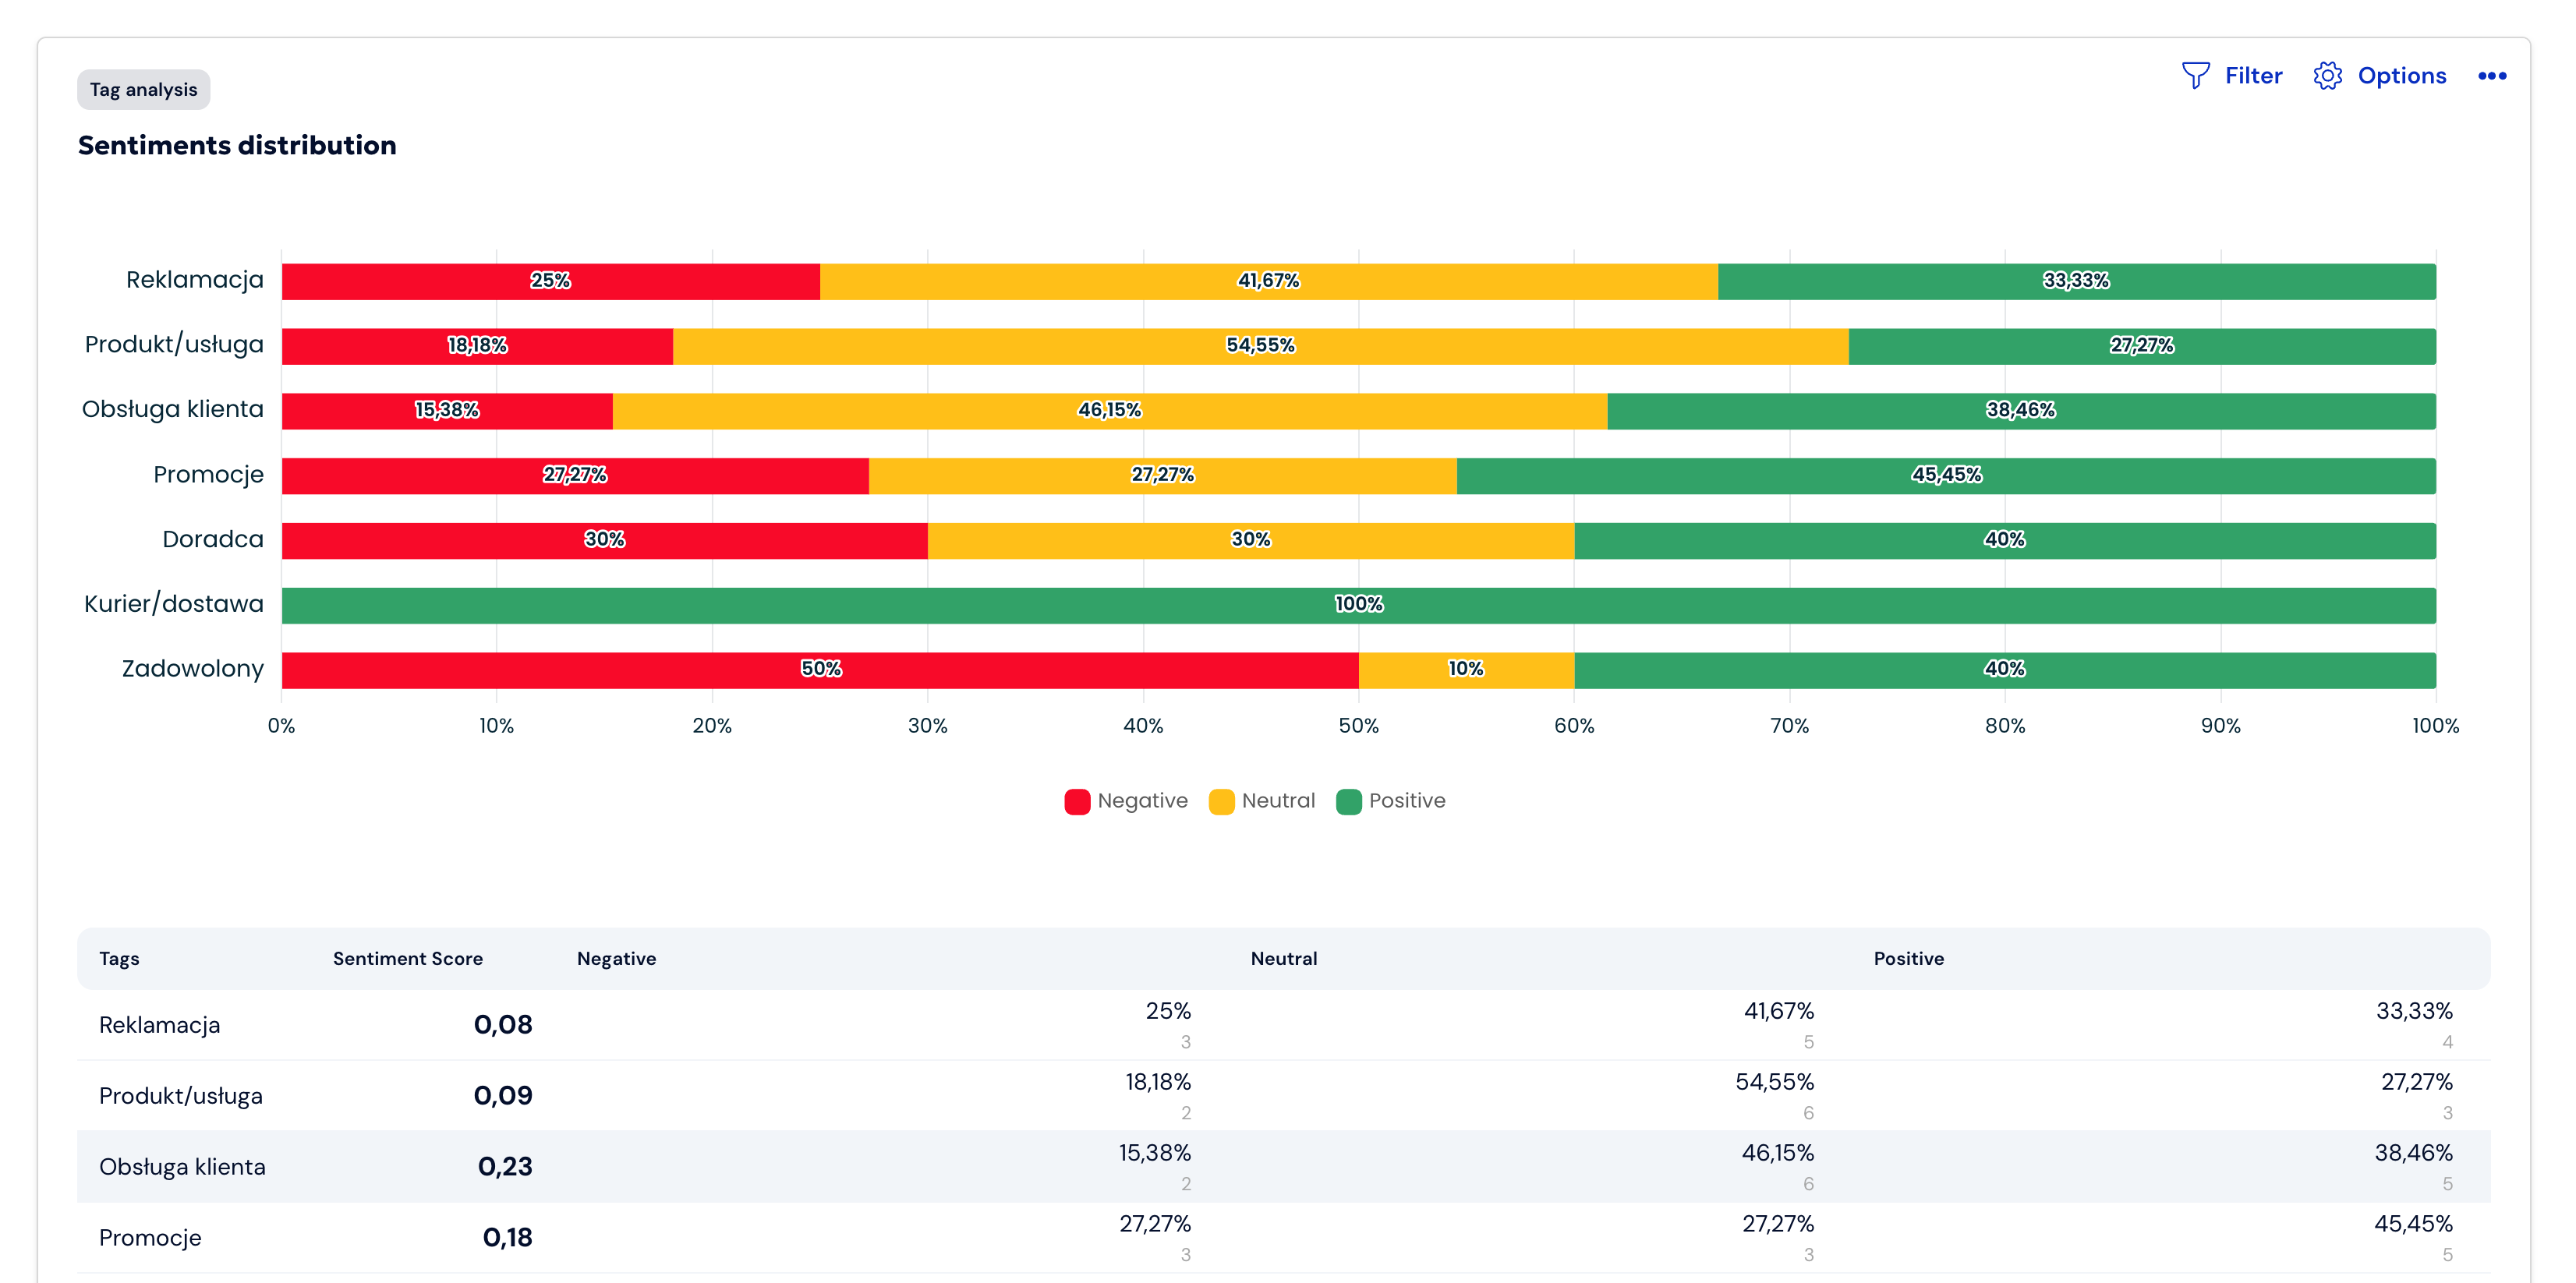
Changing the chart appearance
In the Appearance options, you can also change the type and color of the chart and decide whether to display the chart with a table or just the chart or table itself. Depending on the type of question, various ways of presenting the results are available.
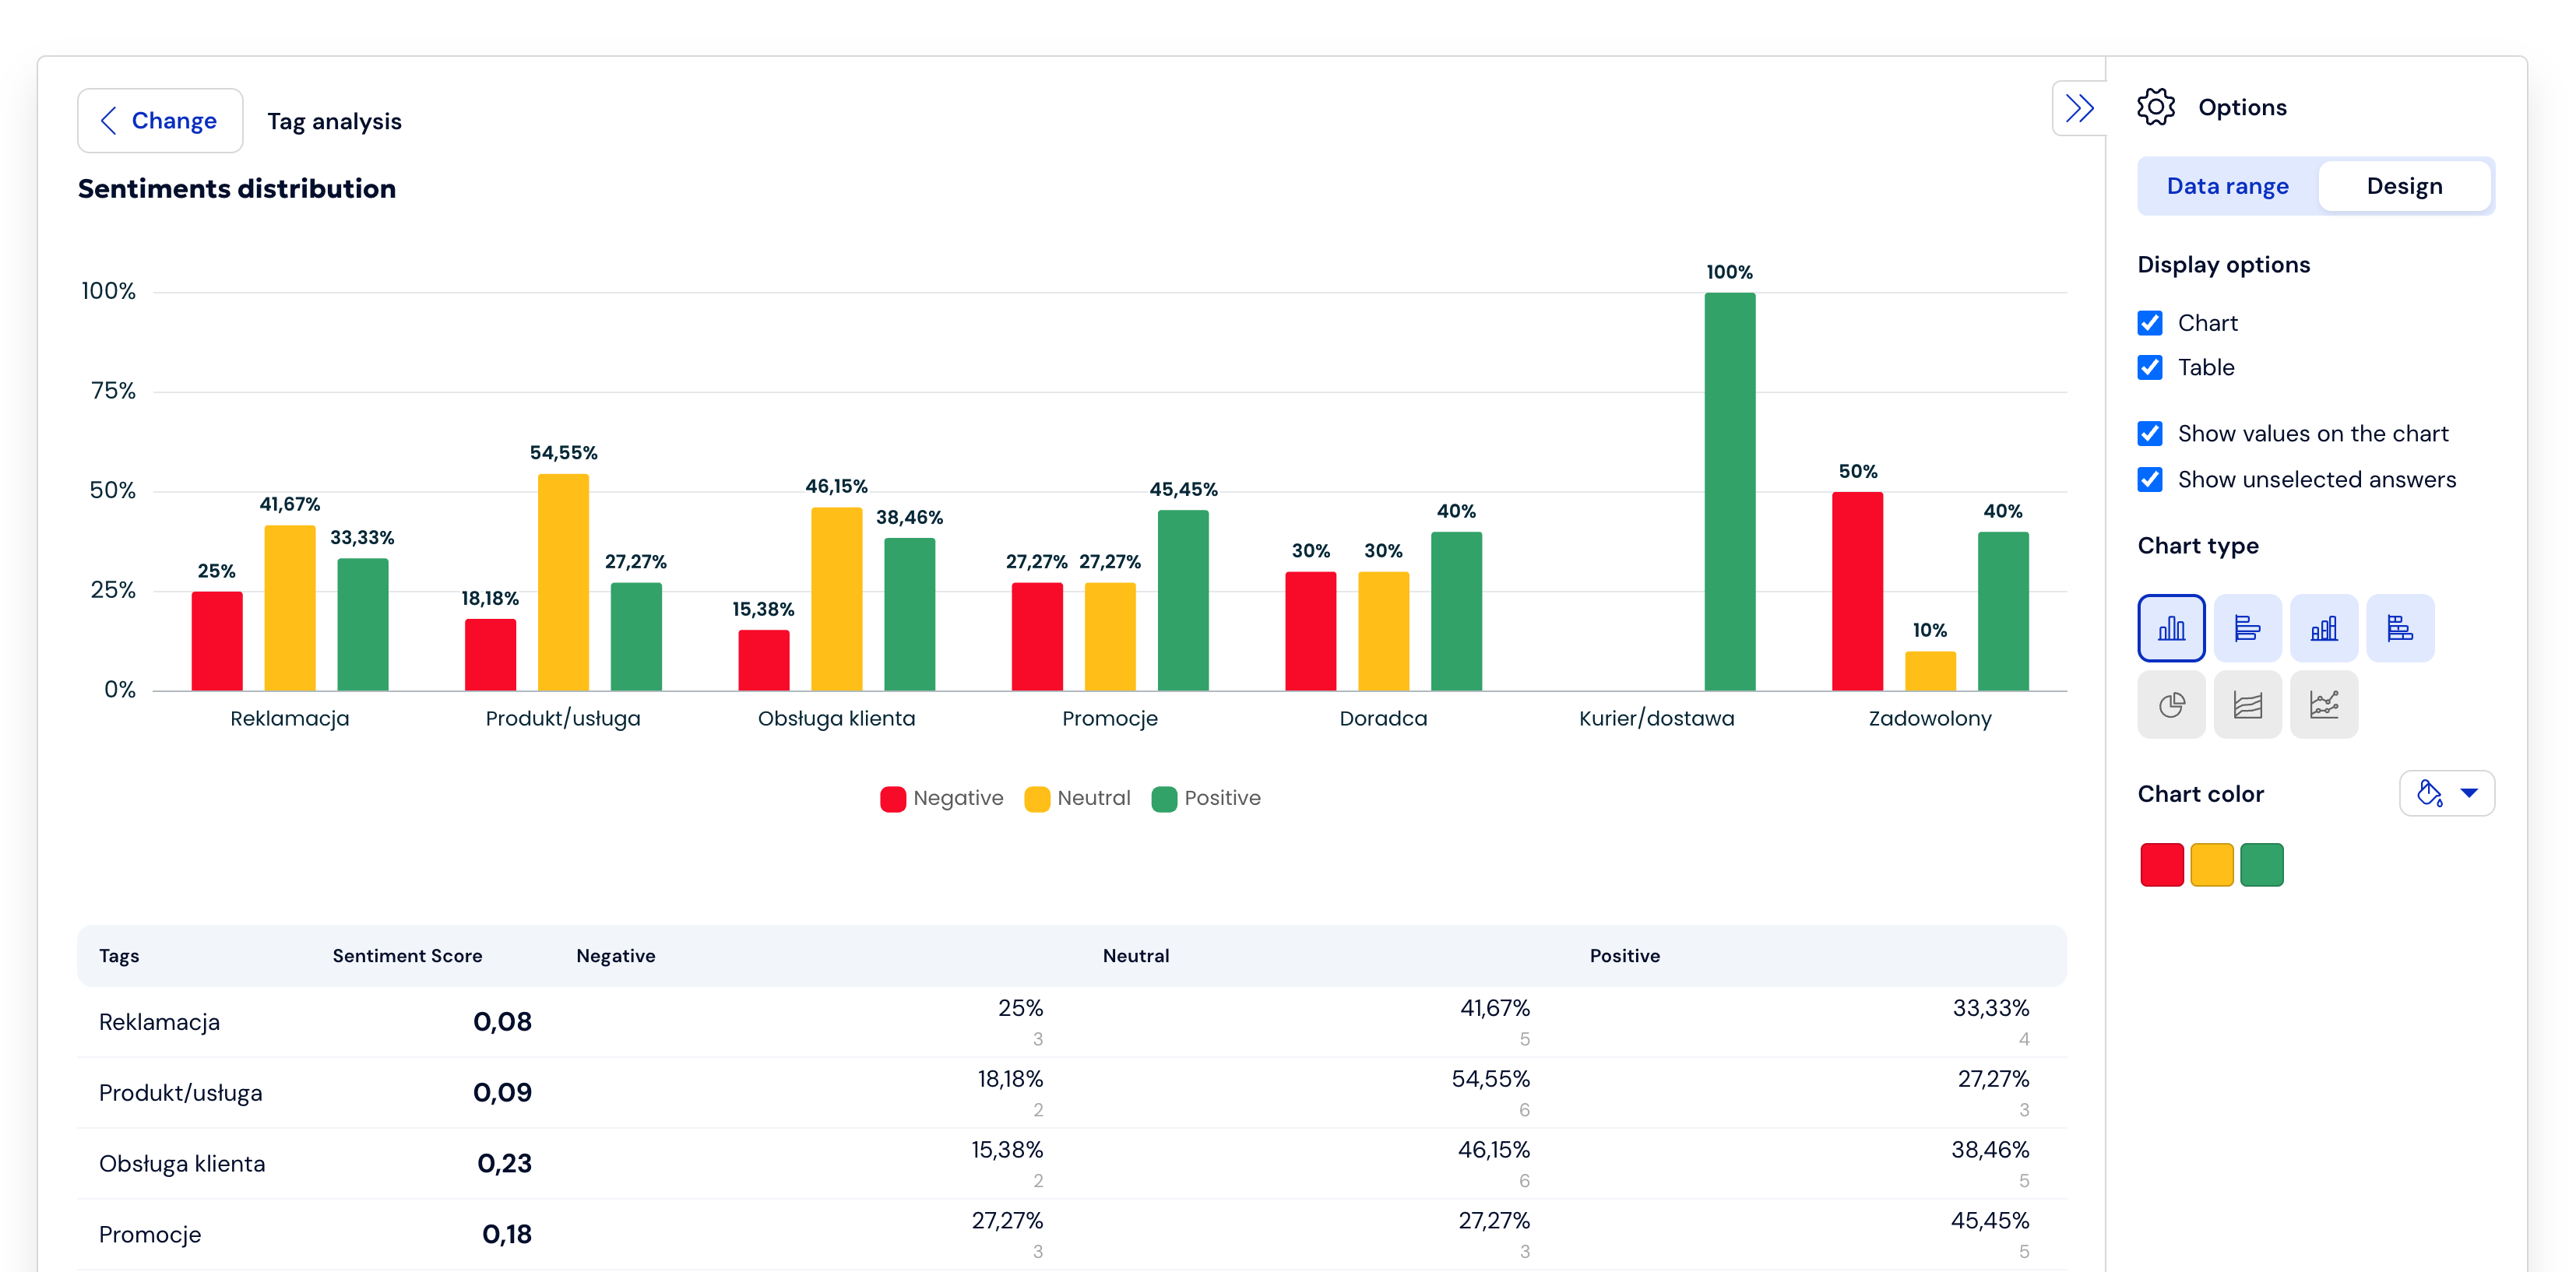
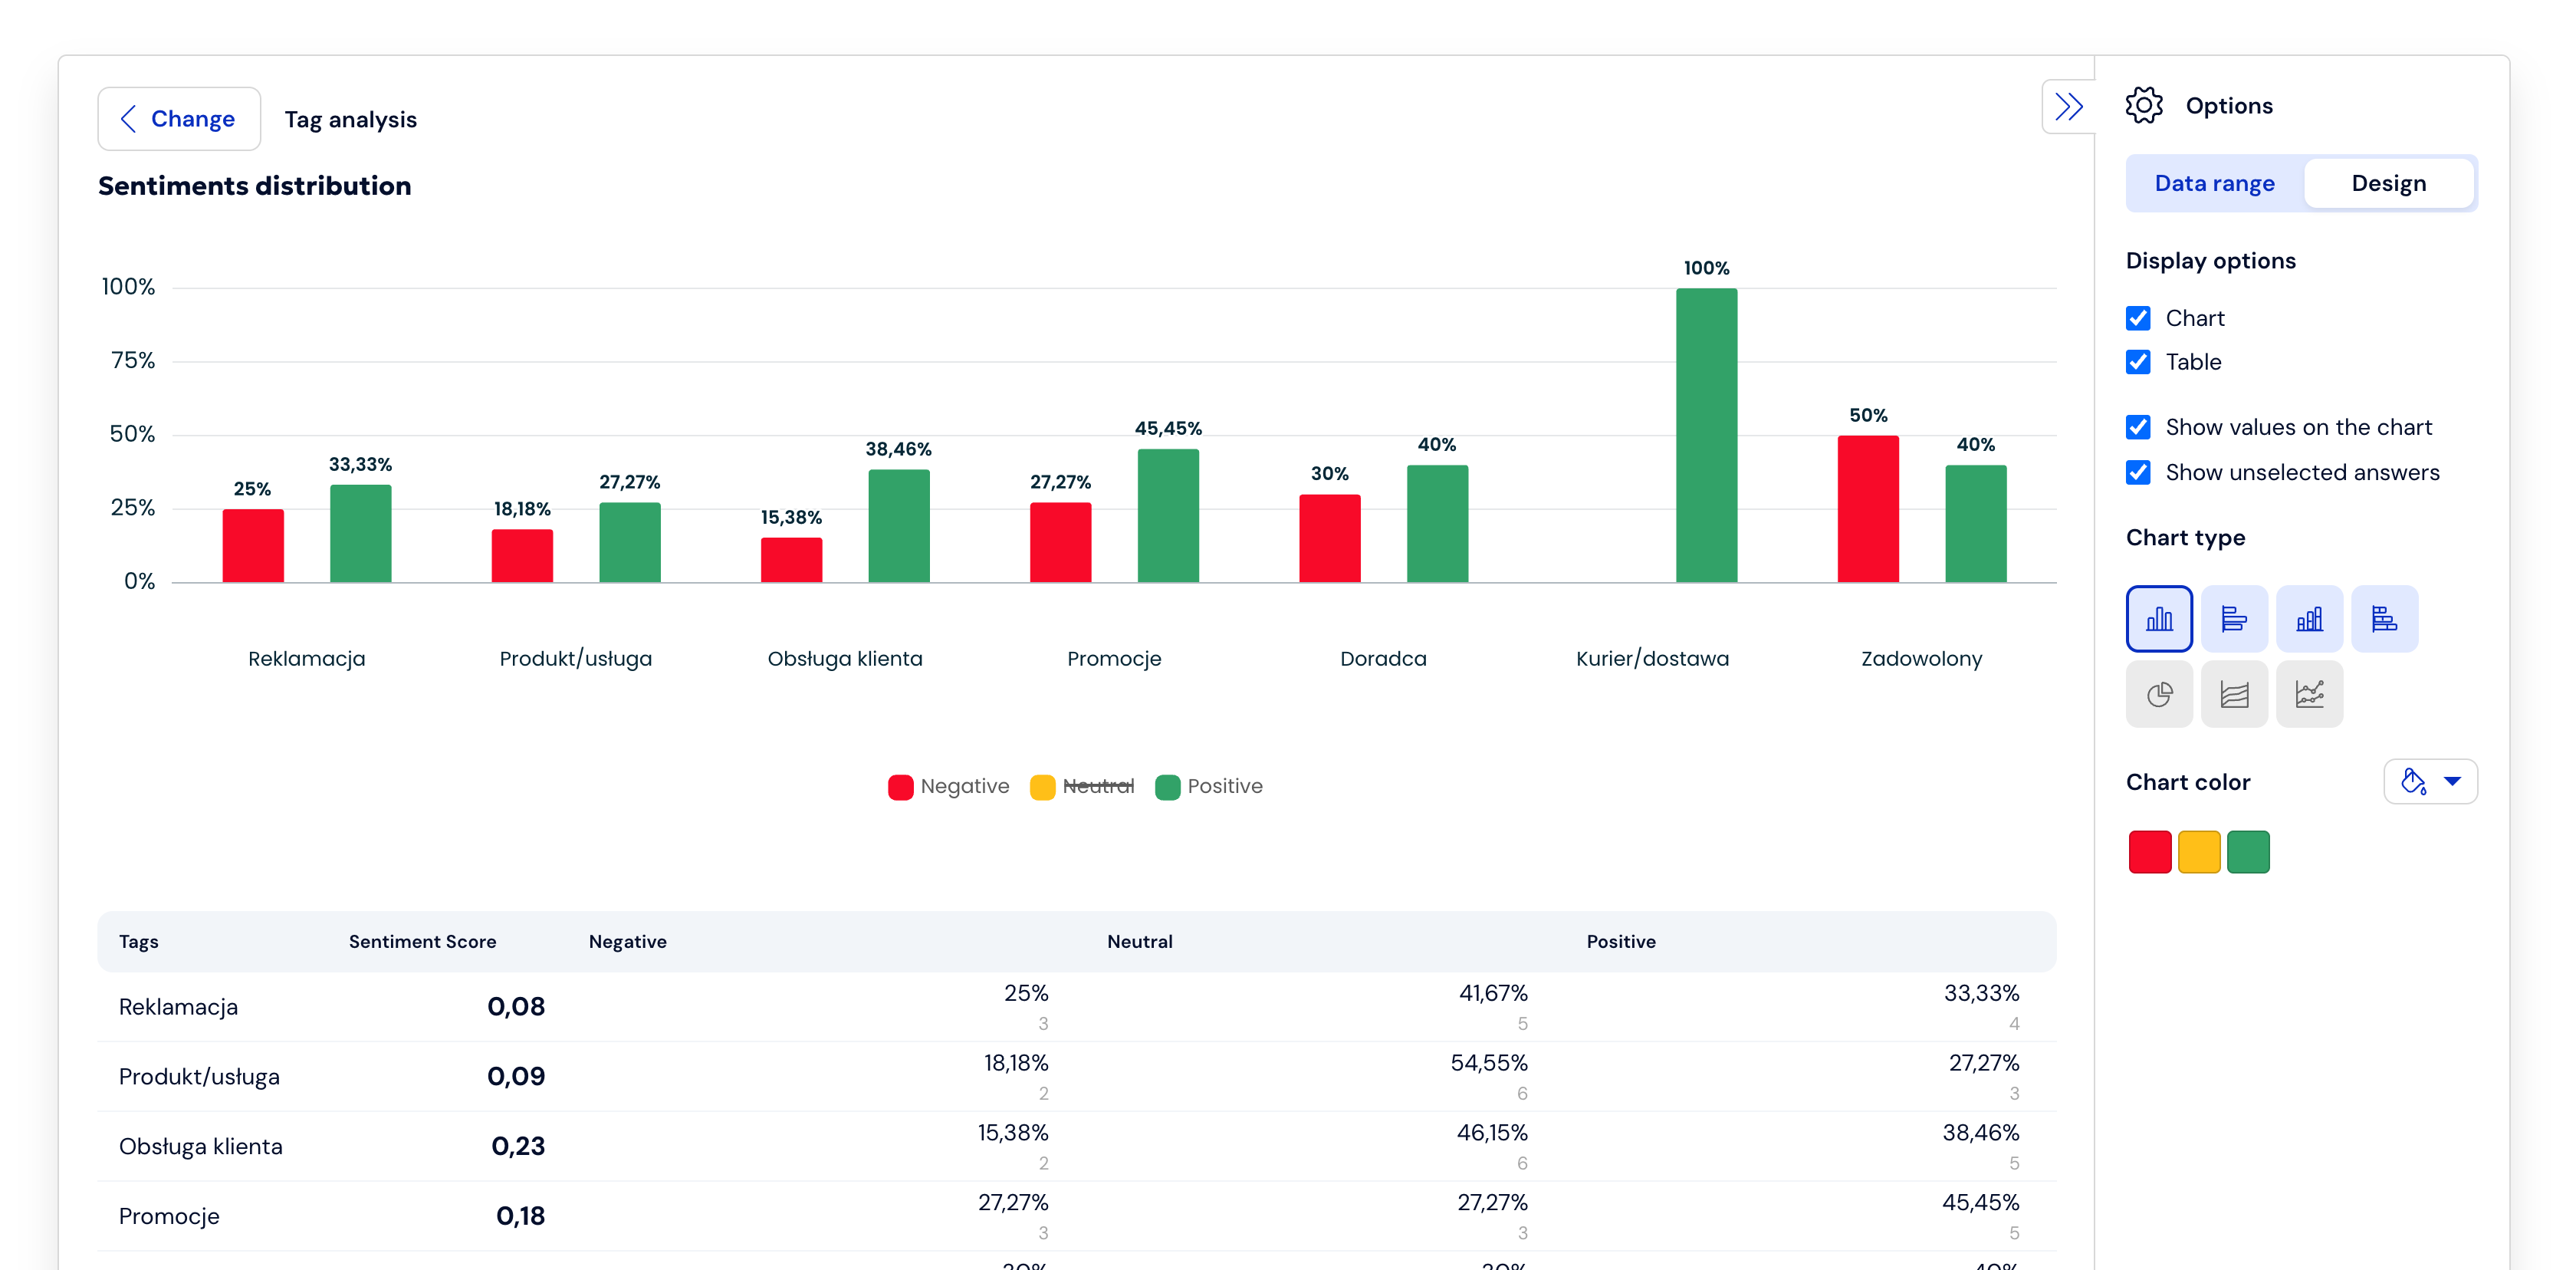
If you want only some answers from a given question to be displayed on the chart, click on the answer in the chart legend, it will be crossed out and removed from the chart.
How to save the comparison?
You can save the comparison in the form of a report. Click Save report as... in the upper right corner of the Results tab.
